


 38 / 63

Ref. No. [UMCES] CBL 2015-013
ACT VS15-06
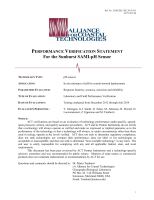
Figure 15.
Time series of pH measured by a SAMI-pH(mCP) instrument during the 1 month CBL field
trial.
Top Panel
: Continuous pH
Total
recordings from instrument (blue line) and pH
Total
of adjacent grab
samples determined by mCP dye (red circles).
Bottom Panel
: Difference in measured pH relative to
reference samples (Instrument – Dye Ref) observed during deployment. Zero offset is represented by
dashed line as pH
Total
scale is reported by the SAMI-pH sensor and the dye reference method.
38