


 28 / 48

Ref. No. [UMCES] CBL 2015-012
ACT VS15-05
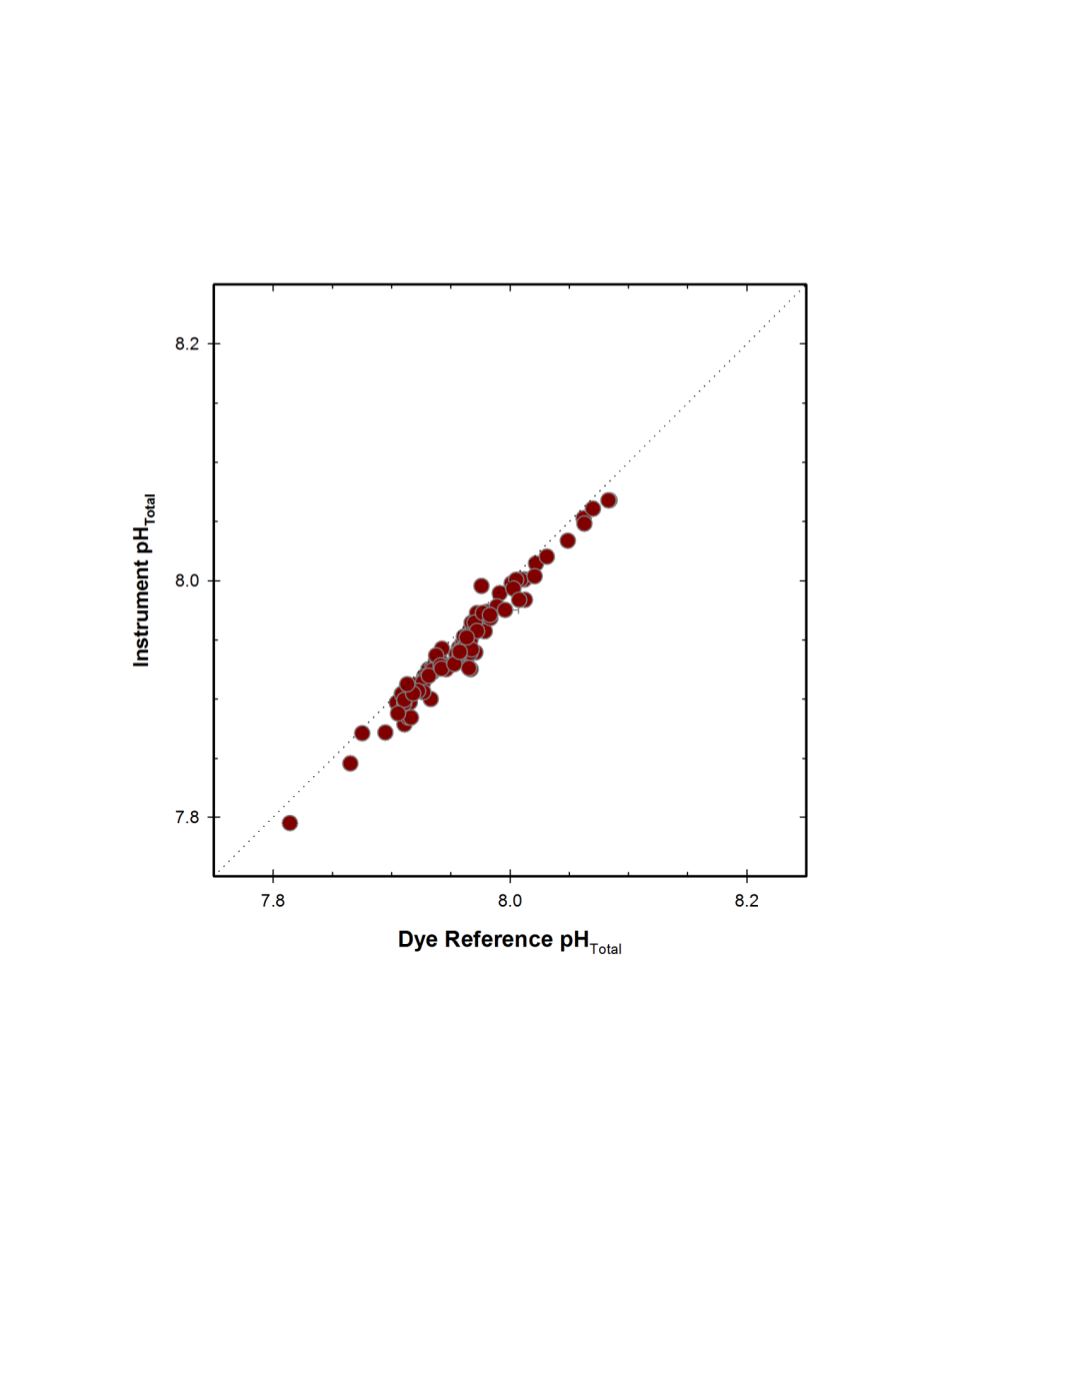
A cross-plot of the matched observations is given in figure 8. A linear regression of the
data was highly significant (p<0.001, r
2
= 0.96) with a slope of 1.01and intercept of 0.11.
Figure 8.
HIMB field response plot of a pumped SeaFET instrument compared to reference pH
Total
samples. Fine dotted line represents 1:1 correspondence, as pH
Total
scale is reported by both the SeaFET
and the dye reference method.