


 23 / 48

Ref. No. [UMCES] CBL 2015-012
ACT VS15-05
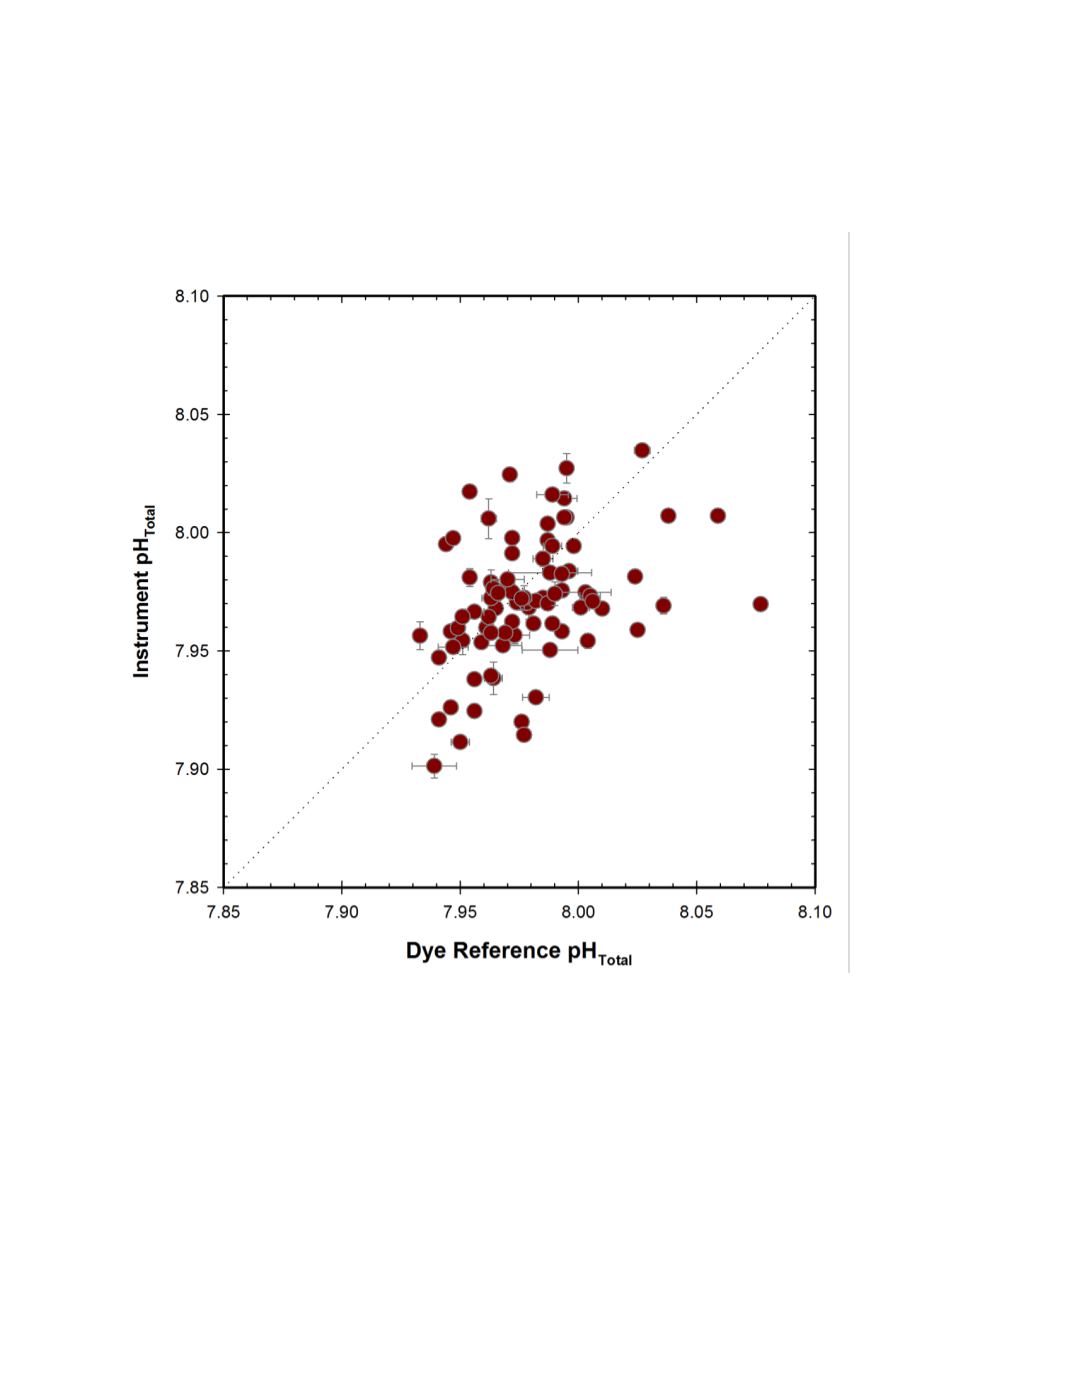
A cross-plot of the matched observations is given in figure 5. A linear regression of the
data was statistically significant but with very low goodness of fit (p <0.001, r
2
=0.15) given the
high scatter around a fairly small range of observations.
Figure 5.
MLML field response plot of a SeaFET pH instrument compared to reference pH
Total
samples.
Fine dotted line represents 1:1 correspondence, as pH
Total
scale is reported by both the SeaFET and the
dye reference method.