


 35 / 60

Ref. No. [UMCES] CBL 2016-016
ACT VS16-07
35
Moored Deployment at Chesapeake Biological Laboratory (CBL)
An eleven week moored field test was conducted in Chesapeake Bay from May 20 to
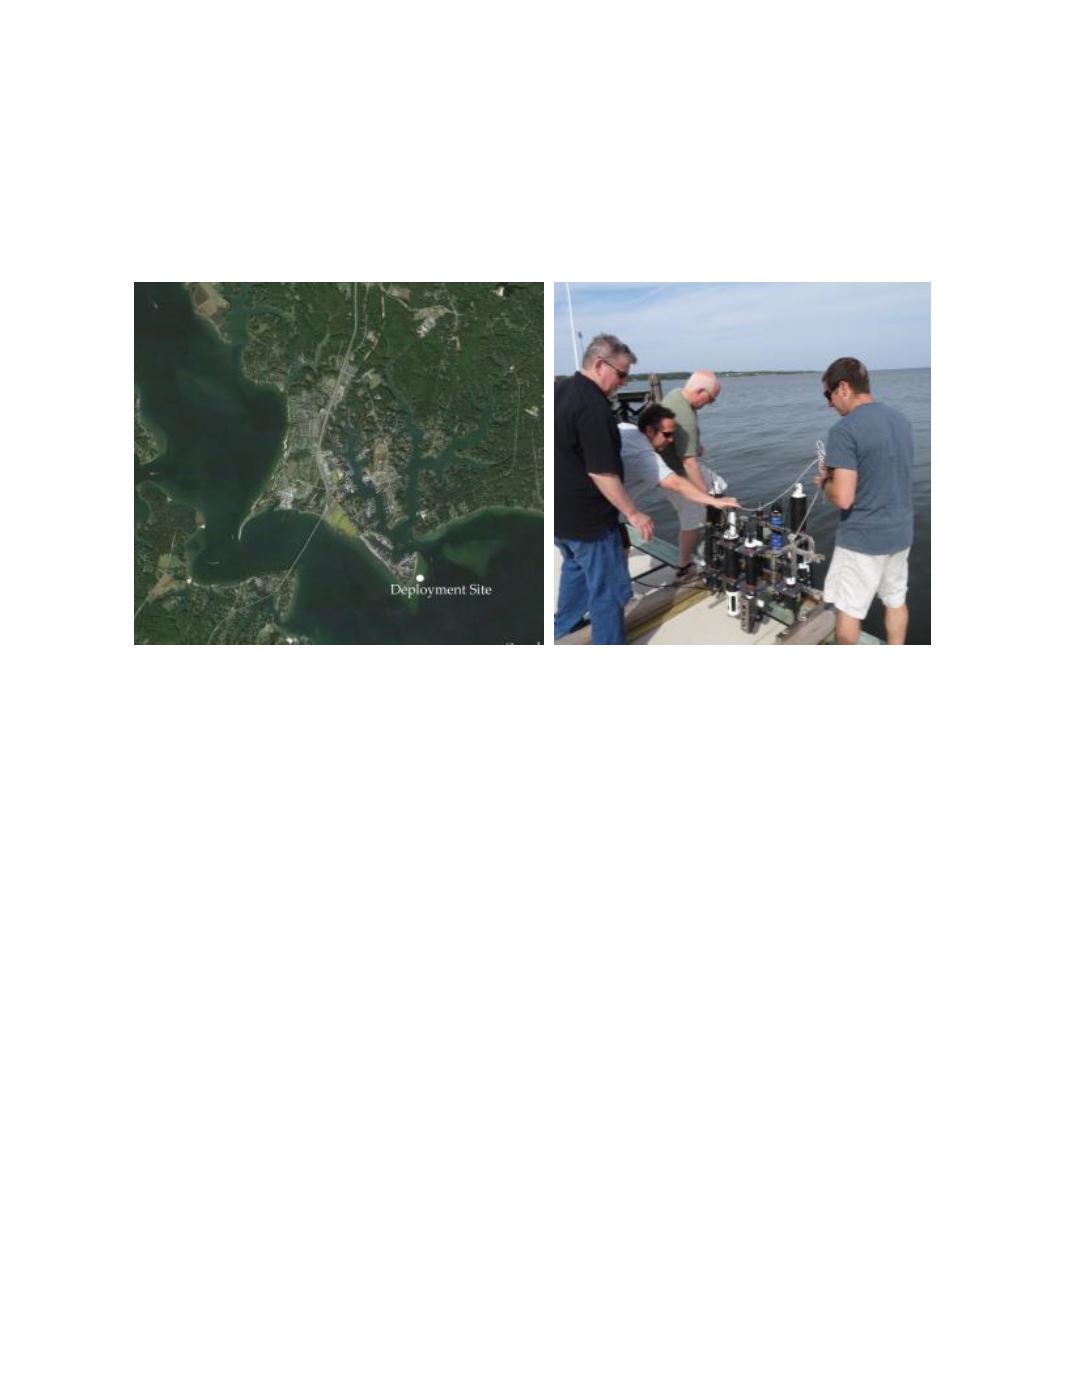
August 5, 2015. The deployment was located at 38.32°N, 76.45°W attached to the side of a pier at
the mouth of the Patuxent River (Photo 3.) The site was brackish with an average water depth of
the test site was 2.2 m.
Photo 3.
Aerial view of CBL deployment site (left) and duplicate sampling at mooring rack.
Time series results of ambient conditions for tidal height, temperature, and salinity are
given in figure 4. Temperature ranged from 19.2 to 30.1 and salinity from 4.7 to 13.7 over the
duration of the field test. The bottom panel displays the maximum difference recorded between all
reference thermistors (RBR Solo and SBE26) mounted at the same depth and different locations
across the mooring rack. The average temperature difference observed across the space of the
mooring rack was 0.21 ±0.25
o
C, with a maximum of 3.26
o
C. Differences between instrument and
reference readings resulting from this variability should be minimized as the sampling bottle
integrates across the mooring space.
The Troll 9000 started to show significant drift around June 20
th
and transmitted unuseable
data from July 4 to the end of deployment on August 4. The Troll 9000 generated 1879 acceptable
measurements (based on ± 2 mg/L from nearest reference sample) from a possible 3639
observations based on its 30 minute sampling interval. The data completion result for the CBL
field deployment was 52%. Time series results of the Troll and corresponding reference DO
results are given in the top panel of figure 5. Ambient DO measured by the Troll ranged from 2.01
to 12.18 mg/L compared to the range captured by the reference measurements of 4.370 to 10.858
mg/L. The bottom panel presents the time series of the difference between the Troll and reference
DO for each matched pair (limited to ± 2.0 mg/L DO; n=68 comparisons out of a total of 142. The
average and standard deviation of the measurement difference for the deployment was 0.550
±0.409 mg/L, with the total range of differences between -0.420 to 1.068 mg/L. The drift rate of
instrument offset for the subset of data was -0.146 mg/L/d (r
2
=0.814). This rate would include any
biofouling effects as well as any electronic or calibration drift. However it is likely that data
included after 6/20 reflect a failing instrument and not a normal drift response.