


 32 / 60

Ref. No. [UMCES] CBL 2016-016
ACT VS16-07
32
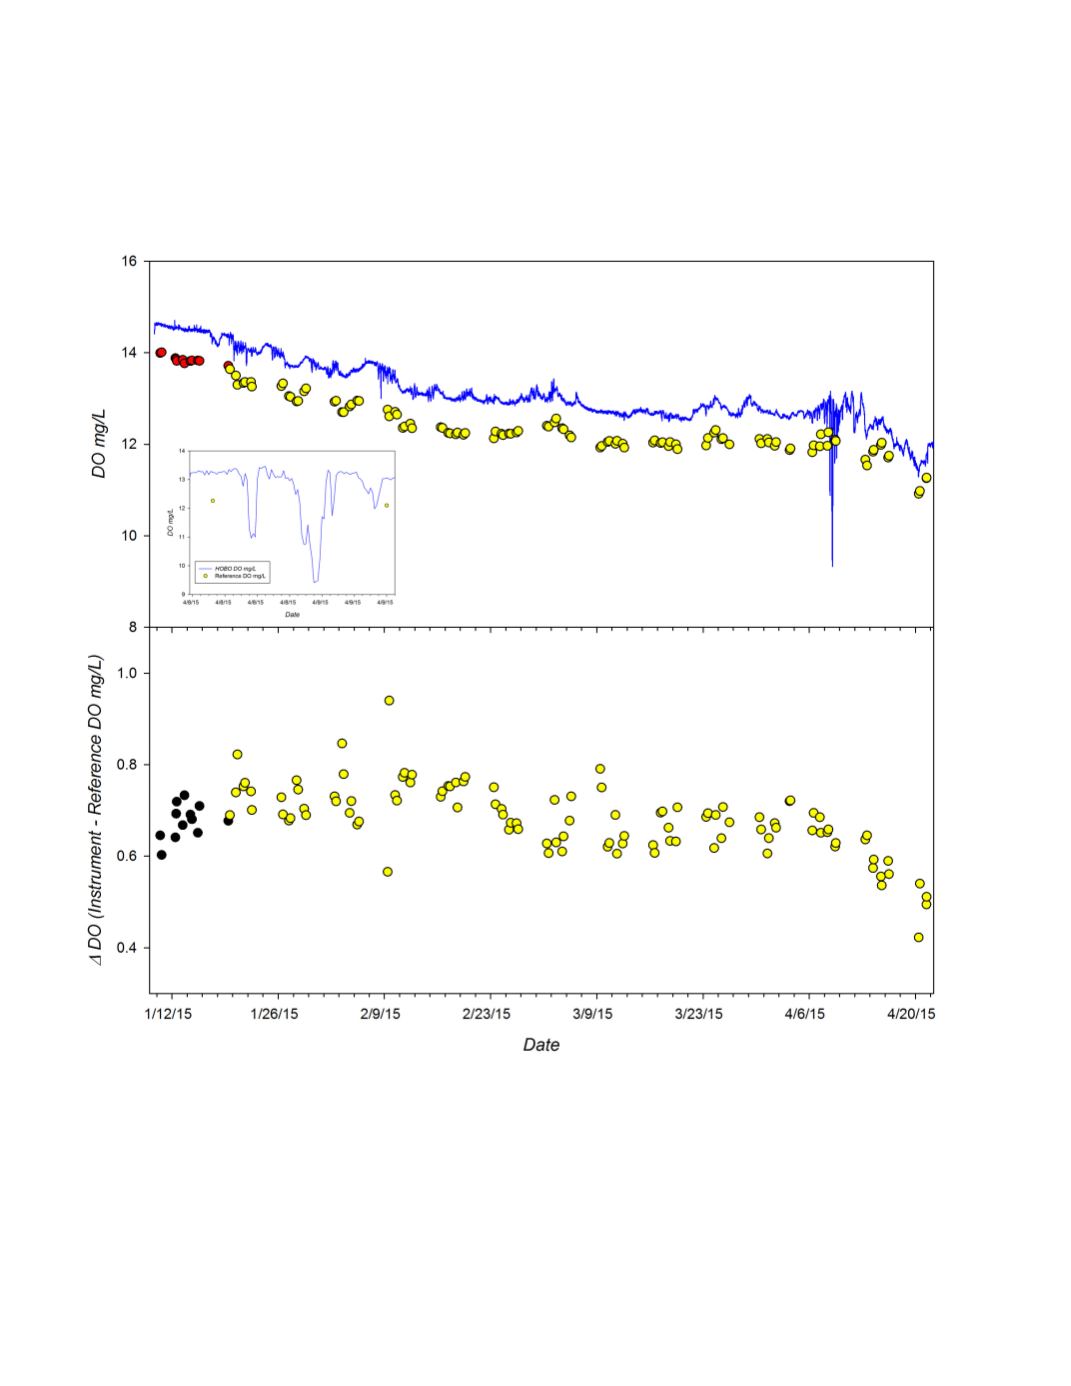
as 0.680 ± 0.072 mg/L with a total range of 0.422 to 0.940 mg/L. The drift rate of
instrument offset, estimated by linear regression (r
2
=0.29), was -0.001 mg/L/d. This rate would
include any biofouling effects as well as any electronic or calibration drift.
Figure 2.
Time series of DO measured dete
c
ted by Troll 9000 deployed during the 15 week Great Lakes
field trial.
Top Panel
: Continuous DO recordings from instrument (blue line) and DO of adjacent grab
samples determined by Winkler titration (red circles; yellow circles represent adjusted reference values).
Bottom Panel
: The difference in measured DO relative to reference samples ((Instrument DO mg/L – Ref
DO mg/L) observed during deployment.
Insert:
Close up of excursion that occurred 4/8-4/9. No reference
samples were collected during this time period.