


 36 / 59

Ref. No. [UMCES] CBL 2016-011
ACT VS16-02
36
compared to the range captured by the reference measurements of 4.370 to 10.85 mg/L. The
bottom panel presents the time series of the difference between the miniDOT and reference DO for
each matched pair (limited to ±2.0 mg/L; n=109 observations out of a total of 142). The average
and standard deviation of the measurement difference for the deployment was -0.40 ±0.702 mg/L,
with the total range of differences between -1.90 to 0.86 mg/L.
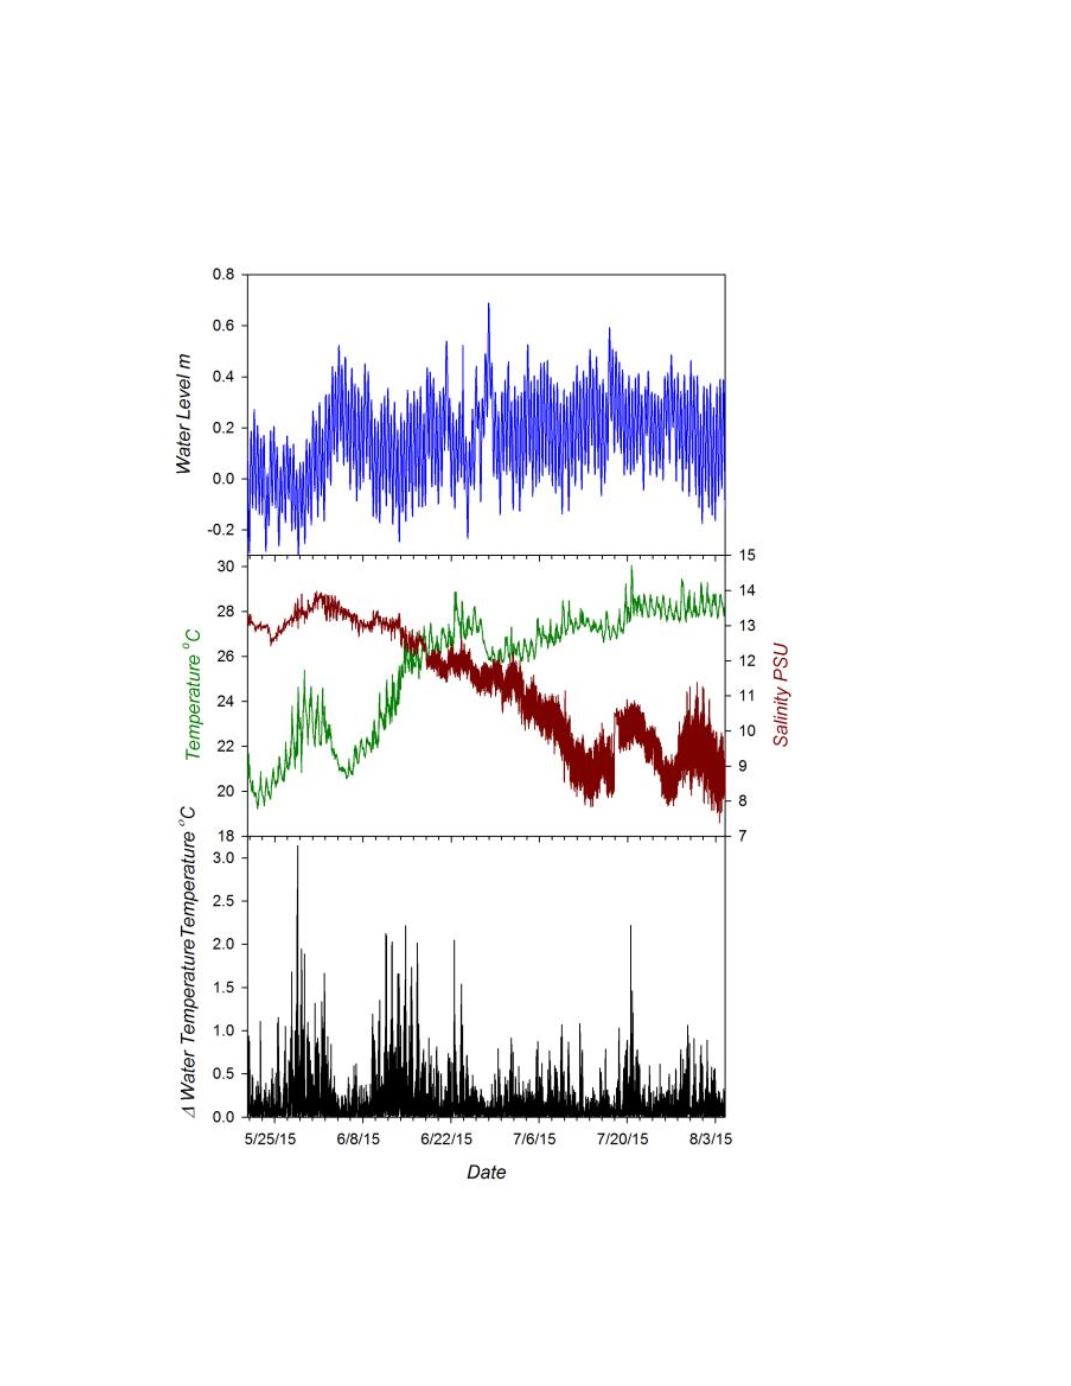
Figure 4.
Environmental conditions encountered during the 11 week CBL floating dock deployment. Test
sensor array deployed at 1 m fixed depth, variation in local tidal heights indicate active water flow around
instrument (
Top Panel
). Variation in salinity (red) and temperature (green) at depth of instrument sensor
detected by an SBE 26 and two RBR Solo thermistors (
Middle Panel
). Temperature range determined from
max-min temperatures detected by RBR thermistors spanning instrument sensor array (
Bottom Panel
).