


 42 / 59

Ref. No. [UMCES] CBL 2016-011
ACT VS16-02
42
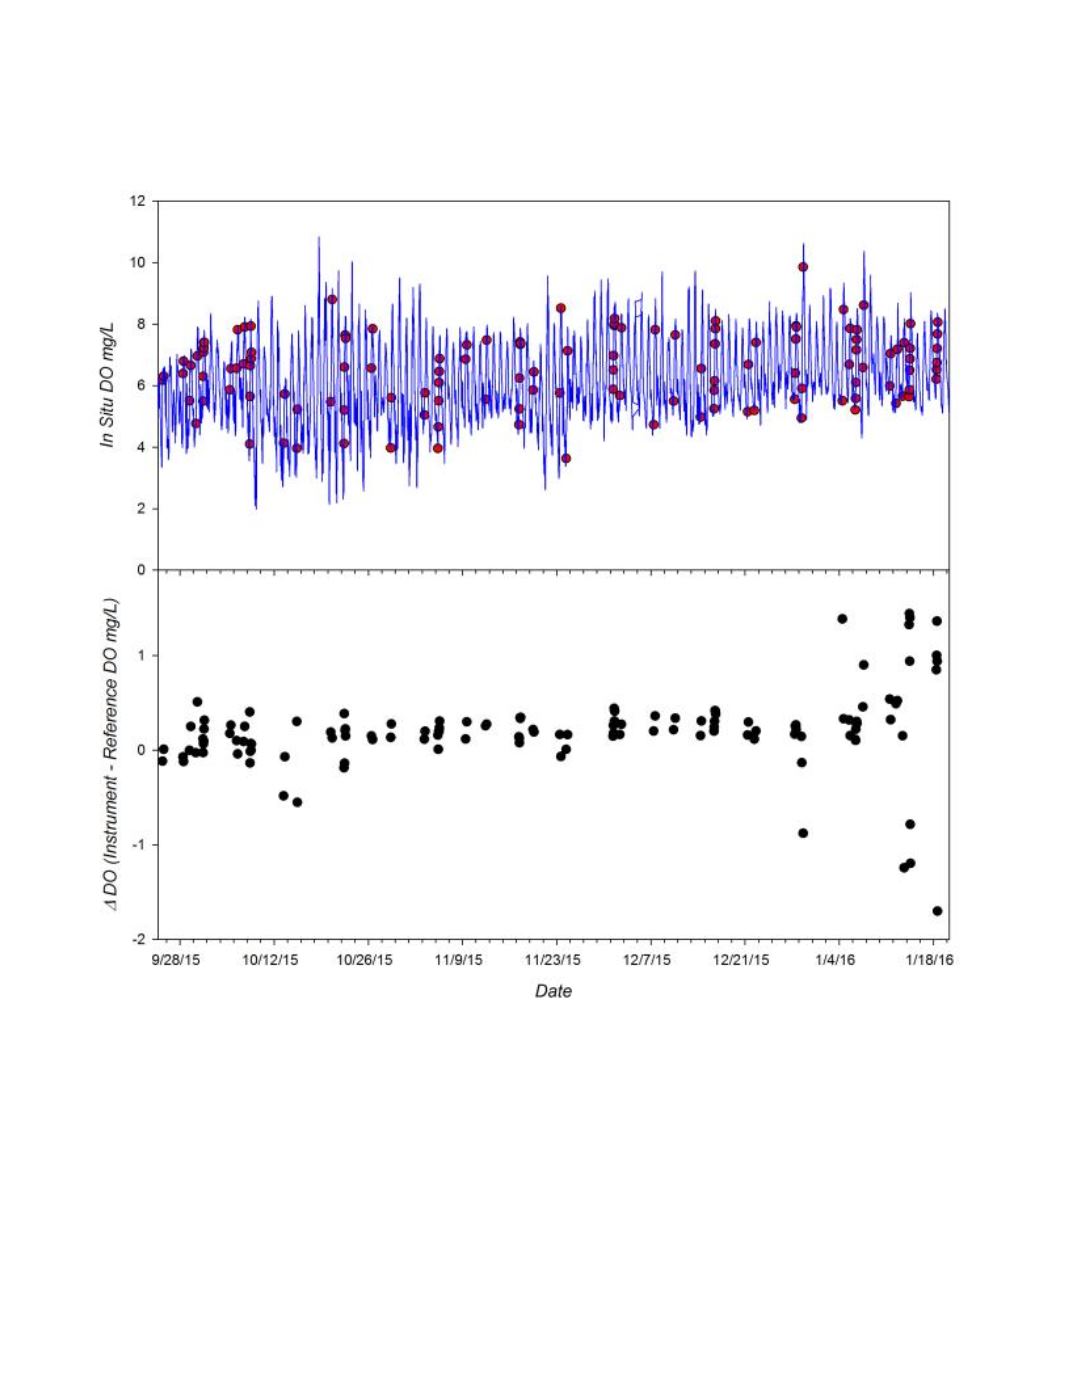
Figure 8
. Top panel:
Time series of DO measured by PME miniDOT deployed during the 18 week HIMB field
trial. Continuous DO recordings from instrument (blue line) and DO of adjacent grab samples determined by
Winkler Titrations (red circles.)
Bottom Panel:
T
ime series of the difference between the PME and reference
measurements (Instrument DO mg/L – Reference DO mg/L) for each matched pair in the range of ±
2mg/L DO (n=128 of a total possible 129 observations).