


 43 / 59

Ref. No. [UMCES] CBL 2016-011
ACT VS16-02
43
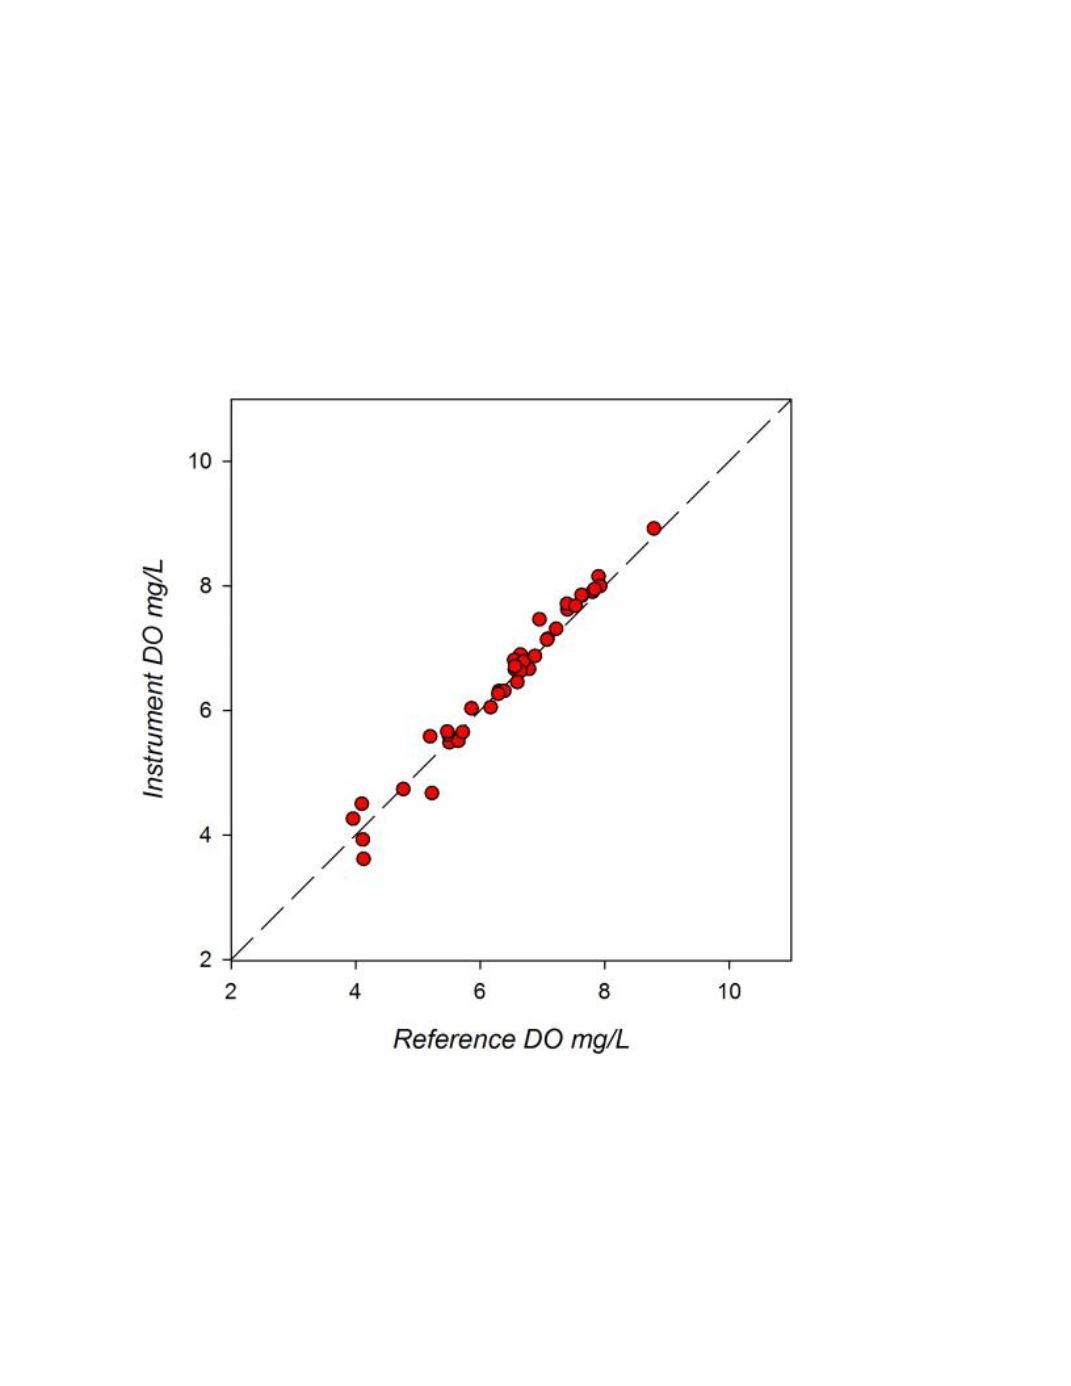
A cross-plot of all matched observations for the first month of deployment is given in
figure 9. Comparisons were limited to one month as a representation of a typical field deployment
and to focus on initial instrument offset versus impacts of biofouling during an extended
deployment. A linear regression of the instrument versus reference measurements (r
2
= 0.97;
p<0.001) had a slope of 1.052 and intercept of -0.258.
Figure 9.
HIMB field response plot of PME miniDOT compared to reference DO samples determined by
Winkler Titration. The plotted line represents a1:1 correspondence.