


 35 / 59

Ref. No. [UMCES] CBL 2016-011
ACT VS16-02
35
Moored Deployment at Chesapeake Biological Laboratory (CBL)
An eleven week moored field test was conducted in Chesapeake Bay from May 20 to
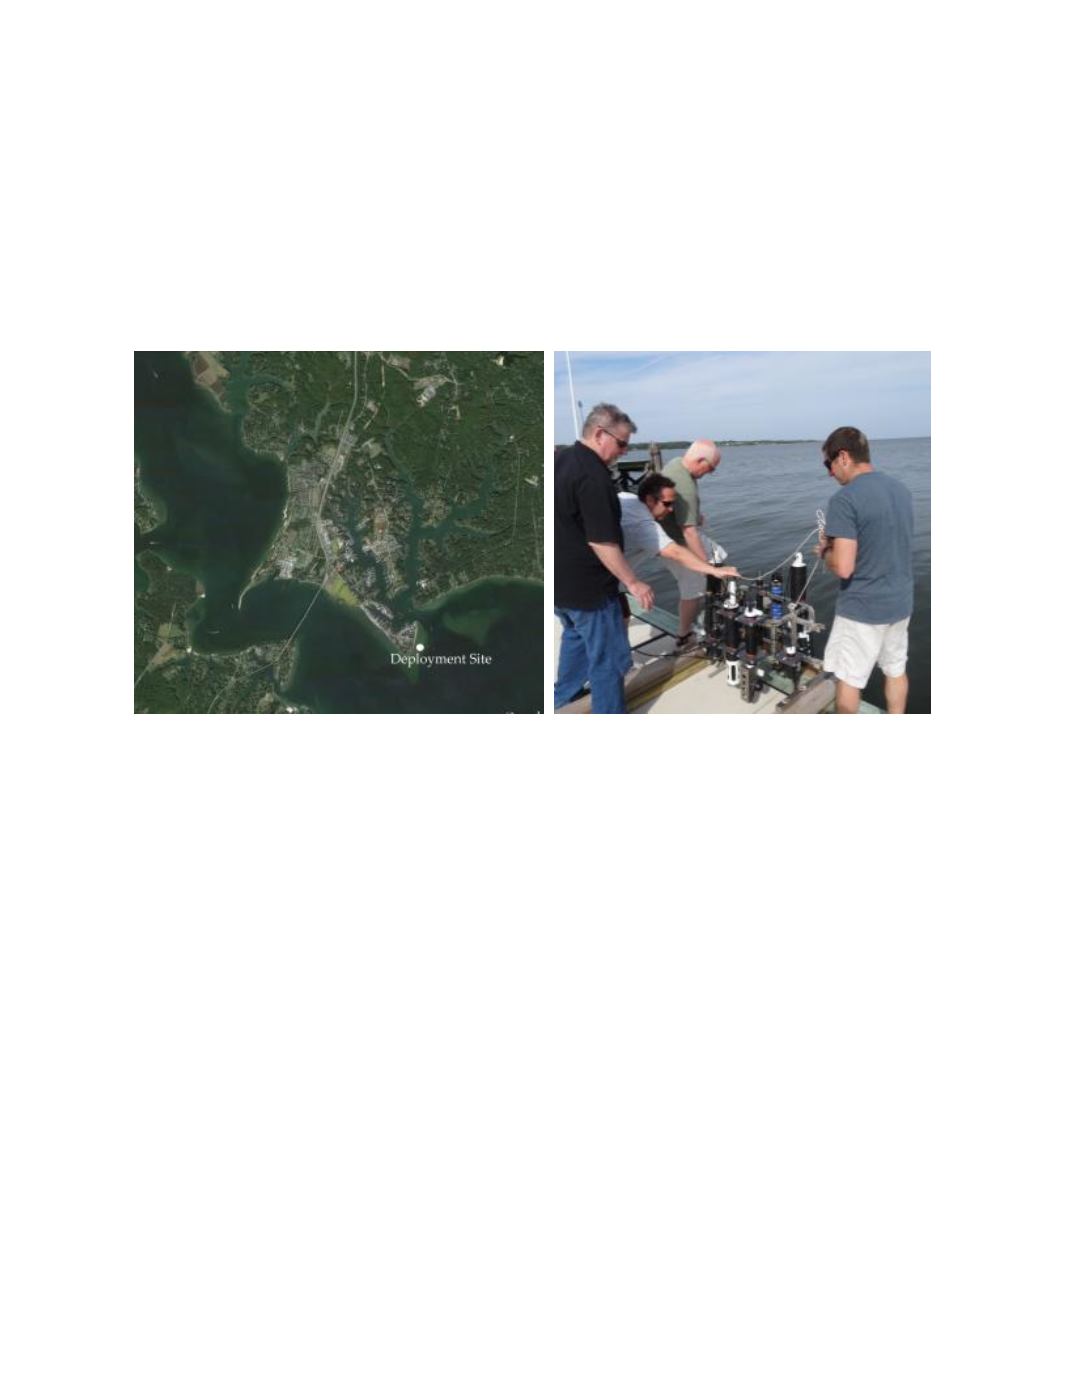
August 5, 2015. The deployment was located at 38.32°N, 76.45°W attached to the side of a pier at
the mouth of the Patuxent River (Photo 3.) The site was brackish with an average water depth of
the test site was 2.2 m.
Photo 3.
Aerial view of CBL deployment site (left) and duplicate sampling at mooring rack.
Time series results of ambient conditions for tidal height, temperature, and salinity are
given in figure 4. Temperature ranged from 19.2 to 30.1 and salinity from 4.7 to 13.7 over the
duration of the field test. The bottom panel displays the maximum difference recorded between all
reference thermistors (RBR Solo and SBE26) mounted at the same depth and different locations
across the mooring rack. The average temperature difference observed across the space of the
mooring rack was 0.21 ±0.25
o
C, with a maximum of 3.26
o
C. Differences between instrument and
reference readings resulting from this variability should be minimized as the sampling bottle
integrates across the mooring space.
The PME miniDOT generated 21,810 from a possible 21,810 observations over the 11
week deployment from May 20 through August 4 based on its 5 minute sampling interval.
However, only 18,173 of the measurements were considered acceptable based on values that were
less than 2 mg/L from any minimum reference sample over a similar timeframe and less than 2
mg/L from continuously monitored DO from a nearby independent data sonde. The accepted data
resulted in a data completion rate for this deployment of 83%. Time series results of the miniDOT
and corresponding reference DO results are given in the top panel of figure 5. Based on weekly
underwater photographs (not presented) and the presence of a barnacle on the sensor foil upon
retrieval we suspect that the pattern of instrument drop off and return seen during July 6-18
represents a differential amount of fouling on the sensor foil that persisted even in the presence of
the wiping system. Ambient DO measured by the miniDOT ranged from 2.00 to 10.65 mg/L