
Ref. No. [UMCES] CBL 2016-011
ACT VS16-02
30
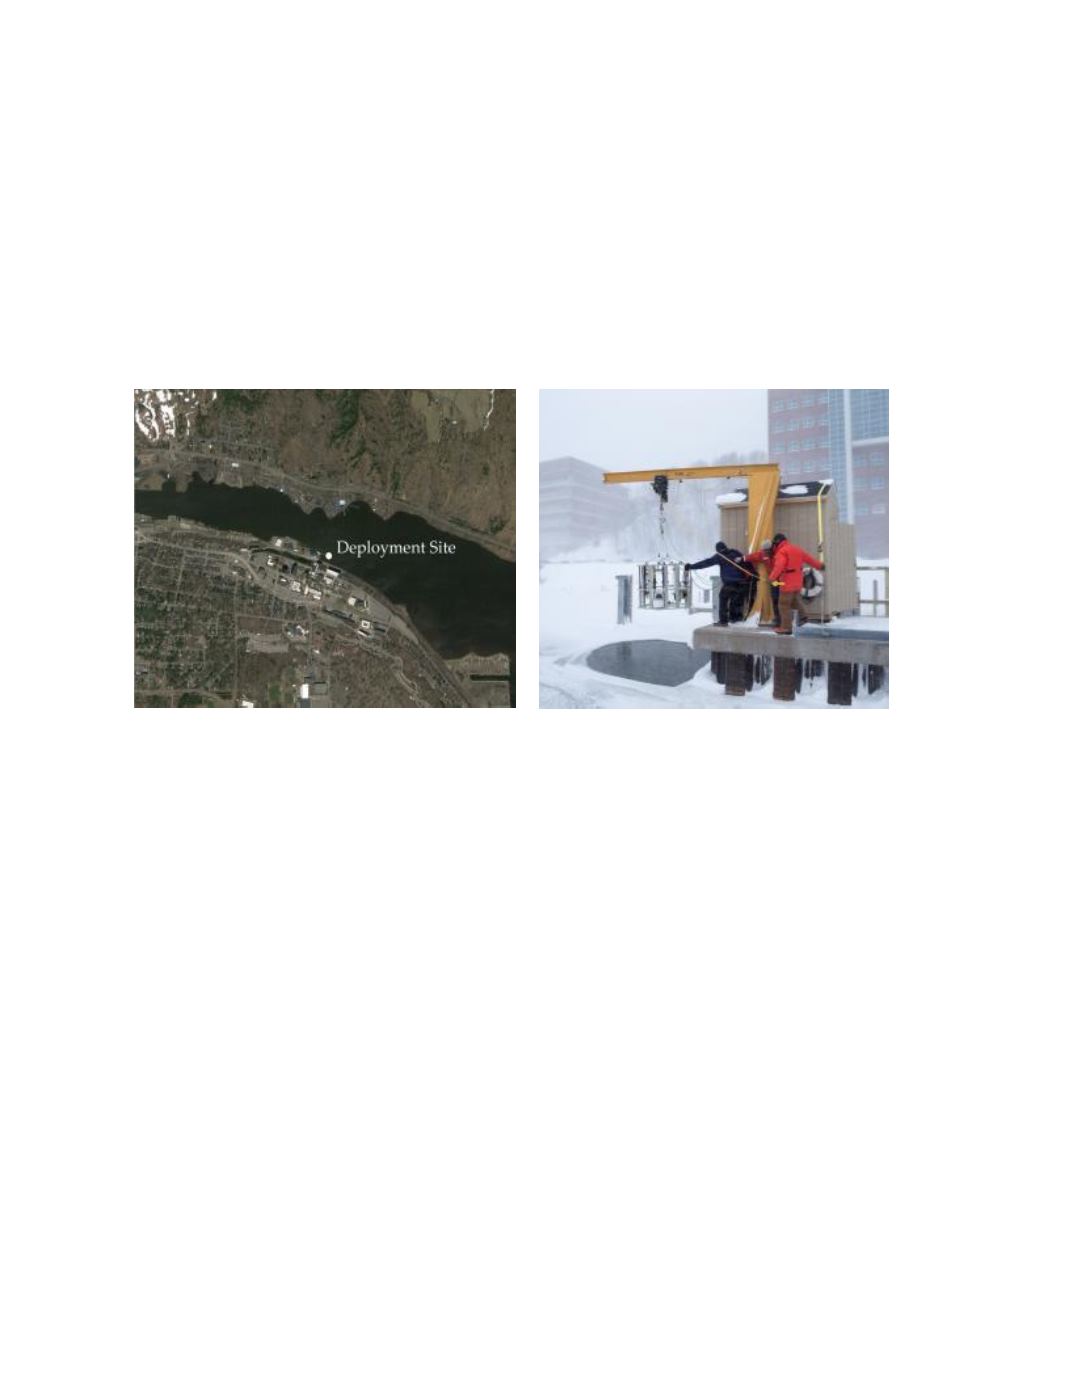
Michigan Tech Great Lakes Research Center Field Deployment Site
A
15 week deployment under ice took place from January 9 through April 22 in the Keweenaw
Waterway adjacent to the Great Lakes Research Center in Houghton, MI. The deployment site
was located at 47.12° N, 88.55° W, at the end of the pier at the Great Lakes Research Center
docks. This site is located on the south side of the Keweenaw Waterway, and is connected to Lake
Superior in both the NW and SE directions. The instrumentation rack was lowered off of the end of
the pier with a ½ ton crane and rested on the bottom, under the ice, in 4.5m of water. A small
shelter was constructed at the end of the pier to provide shelter for processing the reference
samples during winter sampling efforts.
Photo 1.
Aerial view of the Keweenaw Waterway (left) and dockside mooring deployment (right).
Time series results of ambient conditions for temperature and specific conductivity are
given in figure 1. Temperature ranged from 0.04 - 5.3
o
C and specific conductivity from 49 - 110
µS/cm over the duration of the field test. The bottom panel displays the maximum difference
recorded between all reference thermistors mounted at the same depth as the sensors sampling
intakes as well as a meter above, at different locations across the mooring rack. The average
temperature difference observed across the space of the mooring rack was 0.01
°
C with a maximum
of 0.98
o
C. Differences between instrument and reference readings resulting from this variability
should be minimized as the sampling bottle integrates across the mooring space.
Unexpected shifts between adjacent reference samples were noted on three occasions
during the test. Upon inspection it was determined that these excursions occurred during changes
in the batches of Winkler reagents. A correction to reference values was subsequently made based
on the magnitude of change observed between the adjacent Winkler measurements after adjusting
for ambient changes determined by the average of all seven DO sensors deployed on the mooring.
Adjusted values are noted within each figure.
The PME miniDOT operated successfully throughout the entire 15week deployment and
generated 9,859 observations based on its 15 minute sampling interval for a data completion result
of 100%. It should be noted that for this deployment a wiping system was not yet available, so
some caution should be used in comparisons against the other field test results. Time series results
of the PME and corresponding reference DO results are given in figure 2 (top panel). Ambient DO


