


 27 / 59

Ref. No. [UMCES] CBL 2016-014
ACT VS16-05
27
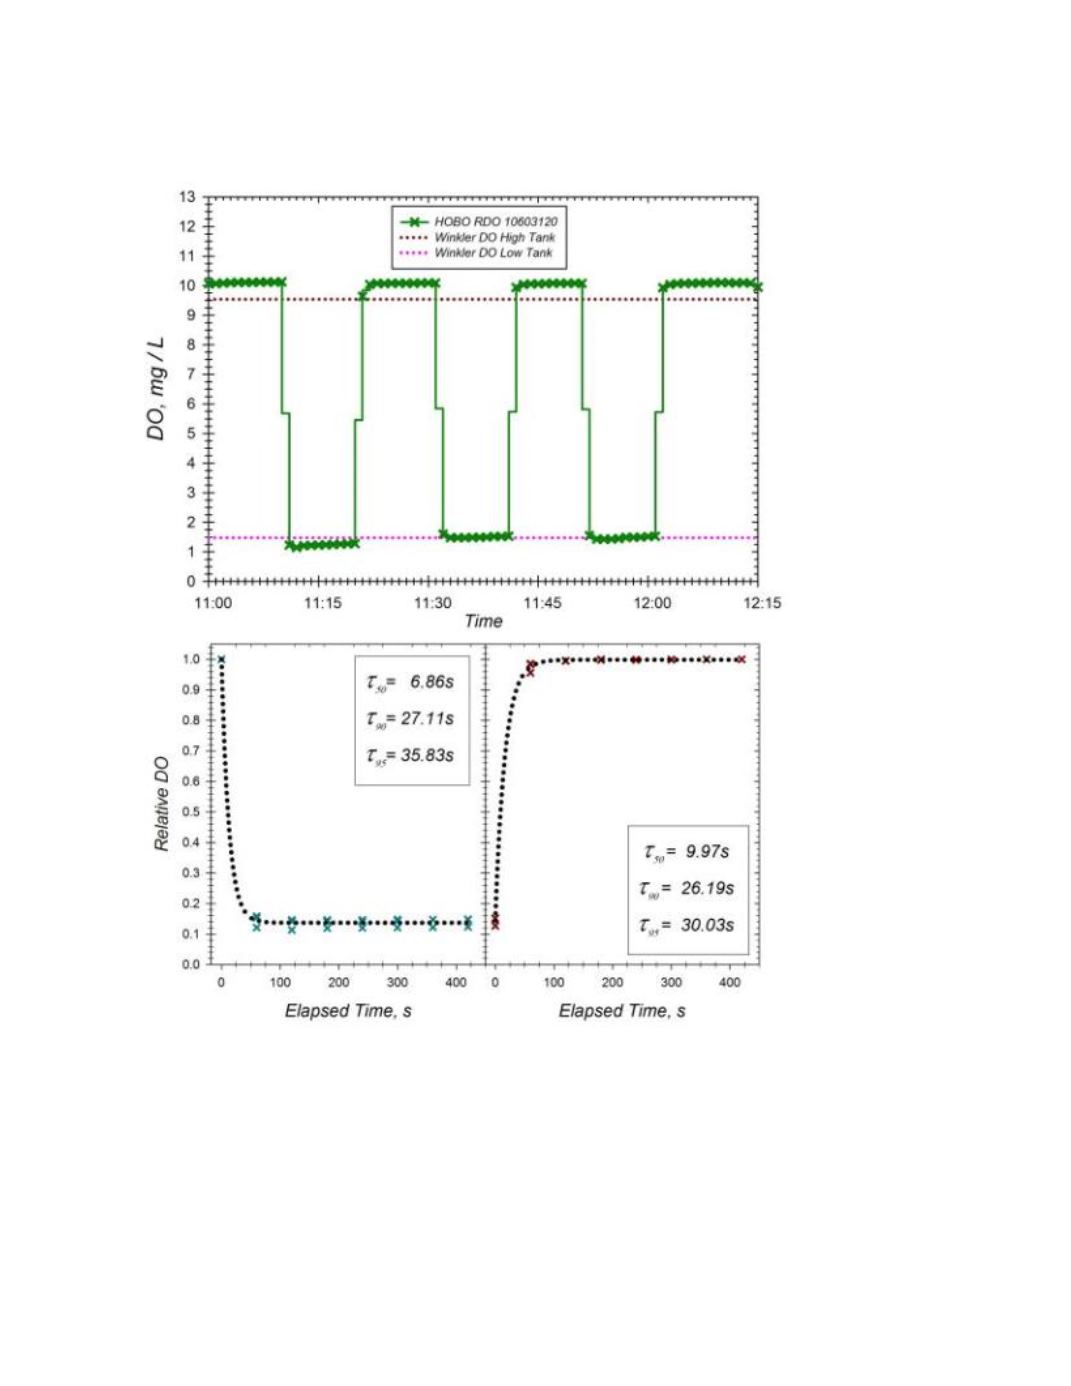
Figure L.
Assessment of the functional sensor response time for the Hach HL4 LDO (sn 0431).
Top
Panel
: Time series of 15s reads of instruments during transfers between high and low DO buckets
maintained adjacent in a common water bath equilibrated at 15
o
C. Indicated DO levels were maintained by
airstone bubblers (high DO) or air+N2 (low DO) and verified by Winkler assays.
Bottom Panels
: All high
DO to low DO transitions were normalized to last reading before condition switch for the indicated time
post transition (left). Data was fit with a 3 parameter exponential decay function: DO
rel
= DO
relMin
+ a
e
-bt
and
indicated
τ calculated from fit. Data for low DO to high DO transitions (
lower right
) were treated
similarly but normalized to steady state value in subsequent high DO tank and subsequently fit with
an analogous 3 parameter exponential rise function:
DO
rel
= DO
relMin
+ a(1-
e
-bt
) with indicated
τ being
directly calculated from fit.