


 33 / 59

Ref. No. [UMCES] CBL 2016-014
ACT VS16-05
33
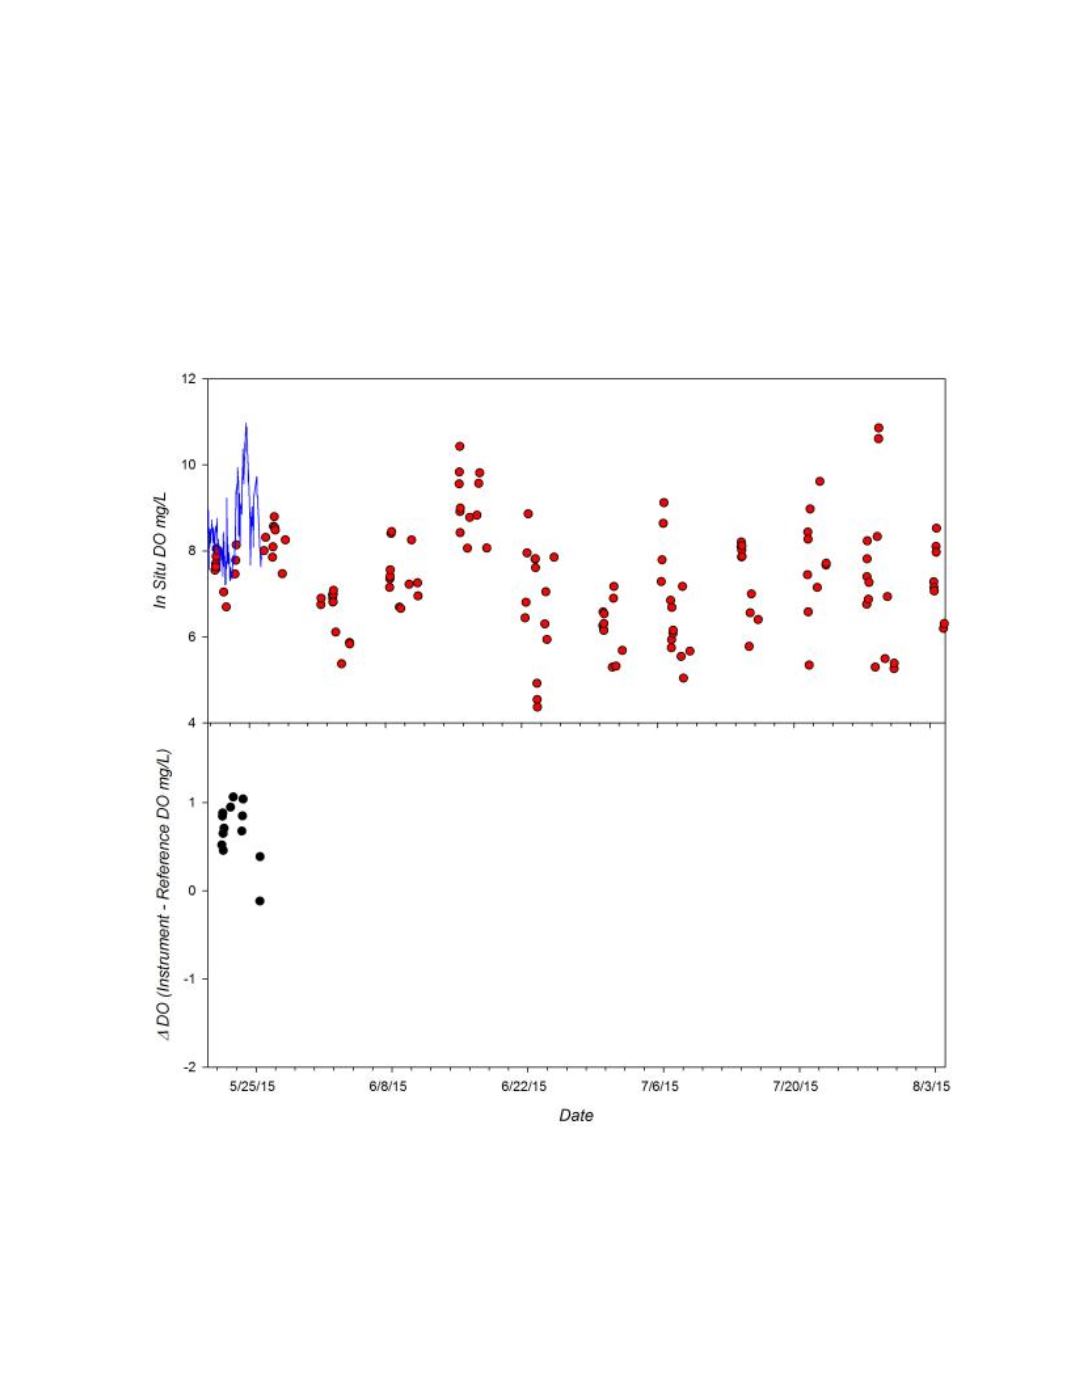
The time series of the difference between instrument and reference DO measurements for
each matched pair (n=14 observations) is given in the bottom panel of figure 3. The average and
standard deviation of the measurement difference over the abbreviated deployment range was
0.685 ± 0.322 mg/L with a total range of -0.12 to 1.06 mg/L. The higher than expected offset may
indicate the instrument was malfunctioning even at the onset of the deployment.
Figure 3.
Time series of DO measured by the HL4 during the 12 week CBL field trial.
Top Panel
:
Continuous DO recordings from instrument (blue line) and DO of adjacent grab samples determined by
Winkler titration (red circles).
Bottom Panel
: Difference in measured DO relative to reference samples
(Instrument – Reference) observed during deployment.