


 34 / 59

Ref. No. [UMCES] CBL 2016-014
ACT VS16-05
34
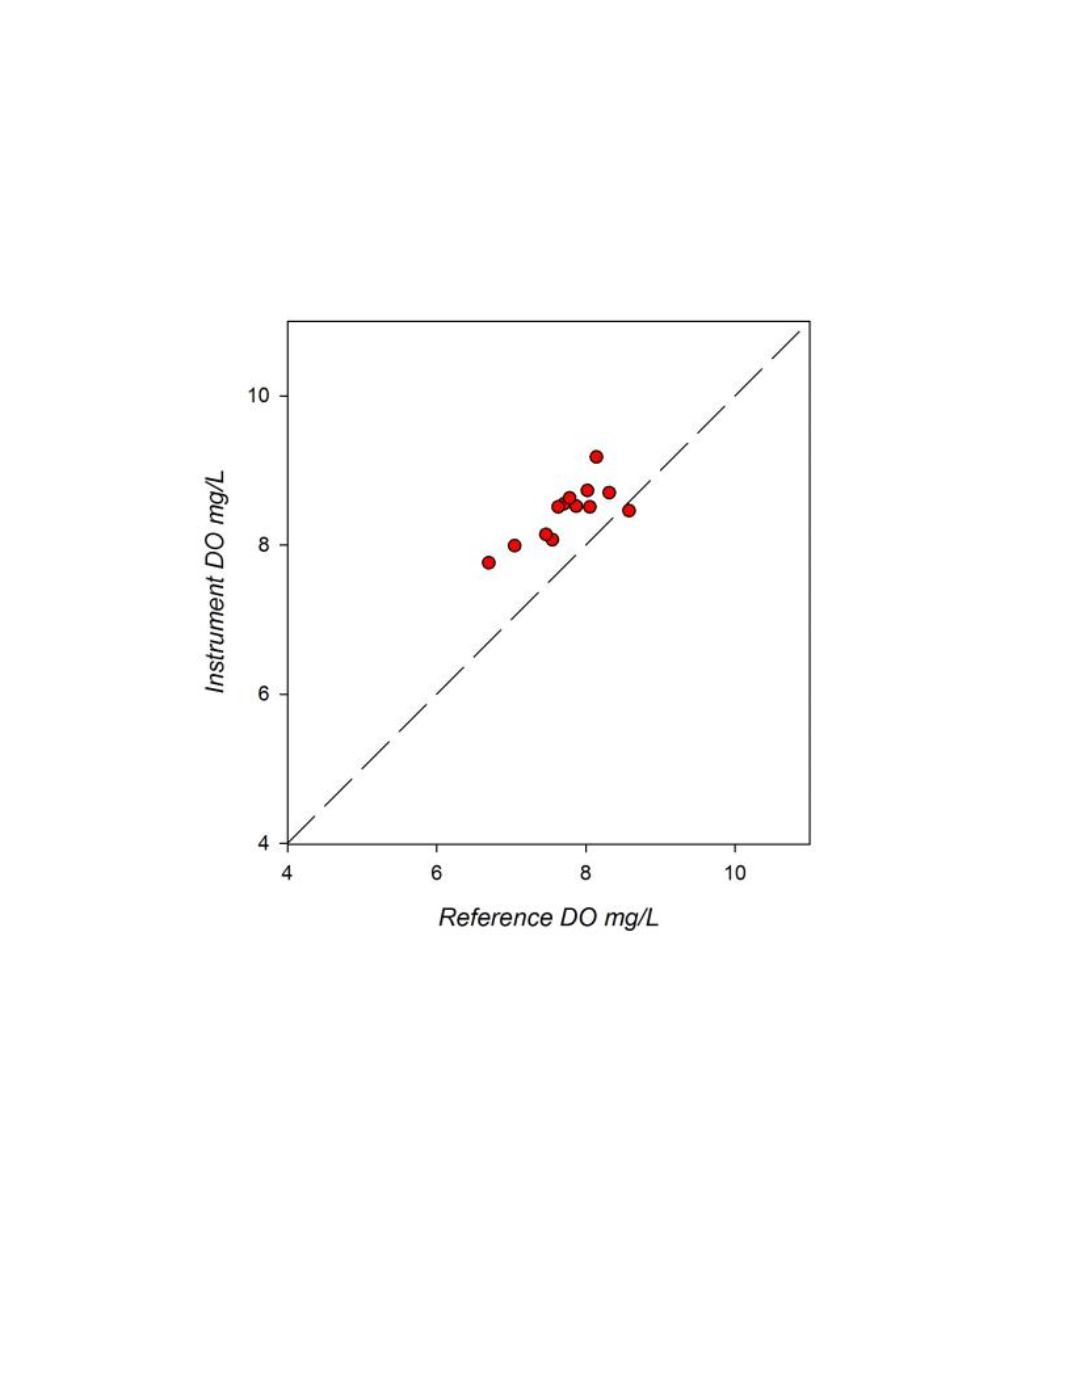
A cross-plot of the matched observations for the abbreviated deployment is given in figure
4. A linear regression of the subset data (r
2
= 0.598; p=0.0019)) had a slope of 0.567and intercept
of 4.046.
Figure 4.
CBL field response plot of HACH HL4 compared to reference DO samples determined by
Winkler Titration. The plotted line represents a 1:1 correspondence.