


 42 / 73

Ref. No. [UMCES] CBL 2015-014
ACT VS15-07
42
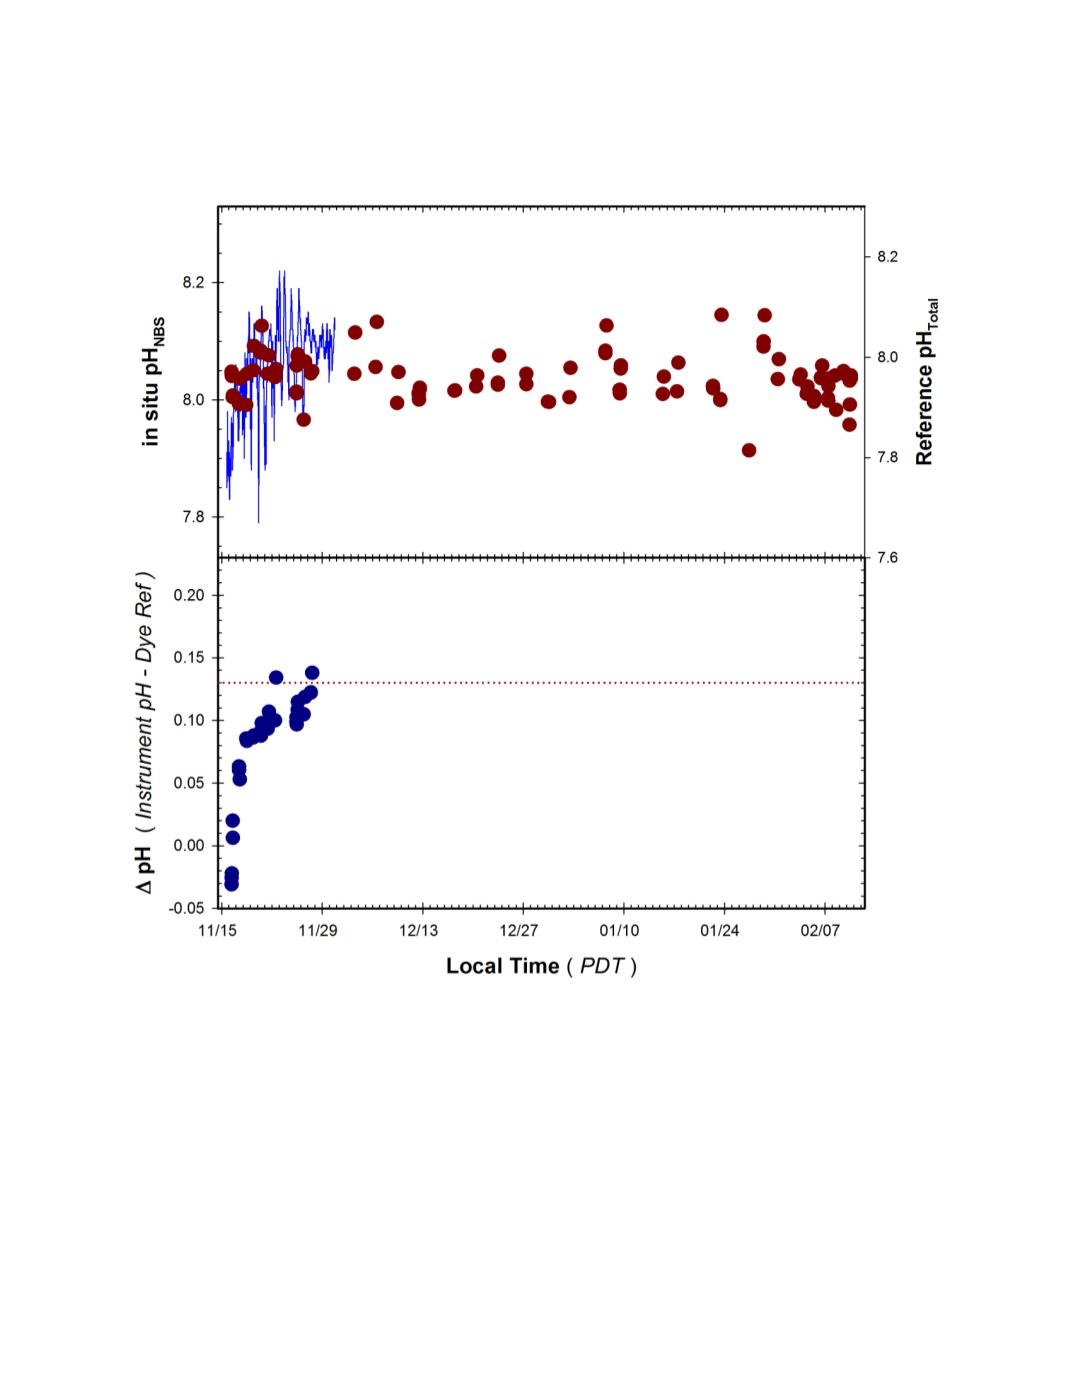
deployment was 0.08 ± 0.05 with a total range of -0.03 to 0.14.
Figure 21.
Time series of pH measured by EXO-pH2 during the 3 month HIMB trial.
Top Panel
:
Continuous pH
NBS
recordings from instrument (blue line) and pH
Total
of adjacent grab samples determined
by mCP dye (red circles).
Bottom Panel
: Difference in measured pH relative to reference samples
(Instrument – Dye Ref) observed during deployment. Dashed line represents offset (ca 0.13) predicted
due to difference in pH
NBS
and pH
Total
scales used by the EXO-pH2 sensor and the dye reference method.