


 40 / 73

Ref. No. [UMCES] CBL 2015-014
ACT VS15-07
40
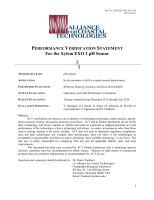
Figure 19.
Time series of pH measured by the Xylem EXO-pH1 during the 3 month HIMB trial.
Top
Panel
: Continuous pH
NBS
recordings from instrument (blue line) and pH
Total
of adjacent grab samples
determined by mCP dye (red circles). Green time series represents second Xylem EXO pH deployed
after failure of the original sonde.
Bottom Panel
: Difference in measured pH relative to reference samples
(Instrument – Dye Ref) observed during deployment. Dashed line represents offset (ca 0.13) predicted
due to difference in pH
NBS
and pH
Total
scales used by the Xylem EXO pH sensor and the dye reference
method.