


 41 / 73

Ref. No. [UMCES] CBL 2015-014
ACT VS15-07
41
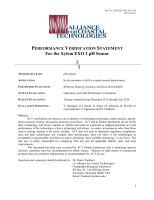
A cross-plot of the matched observations of EXO-pH1 and reference pH is given in
figure 20. The linear regression was statistically significant (p<0.001, r
2
=0.88) with a slope of
1.08 and an intercept of -0.45.
Figure 20.
HIMB field response plot of EXO-pH1 (dark red circles) and the second deployed EXO
sonde pH (grey circles) compared to reference pH
Total
samples. Fine dotted line represents 1:1
correspondence, coarse dotted line represents correspondence predicted based on difference between
pH
NBS
and pH
Total
in seawater (pH
NBS
= pH
Total
+ 0.13).
Time series results of the EXO-pH2 and corresponding reference pH results are given in
figure 21. Ambient pH measured by the EXO-pH2 ranged from 7.79 to 8.22, compared to the
range measured from reference samples of 7.814 to 8.084. The bottom panel presents the time
series of the difference between instrument and reference pH measurements for each matched
pair (n=29 observations out of a possible 101 for the total deployment). The average and
standard deviation of the difference between EXO-pH2 and reference pH over the total