


 48 / 73

Ref. No. [UMCES] CBL 2015-014
ACT VS15-07
48
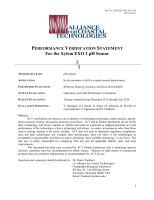
A cross-plot of the matched observations is given in figure 25. The linear regression was
highly significant (p<0.001, r
2
= 0.71) with a slope of 0.58 and intercept of 3.63.
Figure 25.
CBL field response plot a Xylem EXO pH instrument compared to reference pH
Total
samples.
Fine dotted line represents 1:1 correspondence, coarse dotted line represents correspondence predicted
based on difference between pH
NBS
and pH
Total
in seawater (pH
NBS
= pH
Total
+ 0.13).