


 28 / 73

Ref. No. [UMCES] CBL 2015-014
ACT VS15-07
28
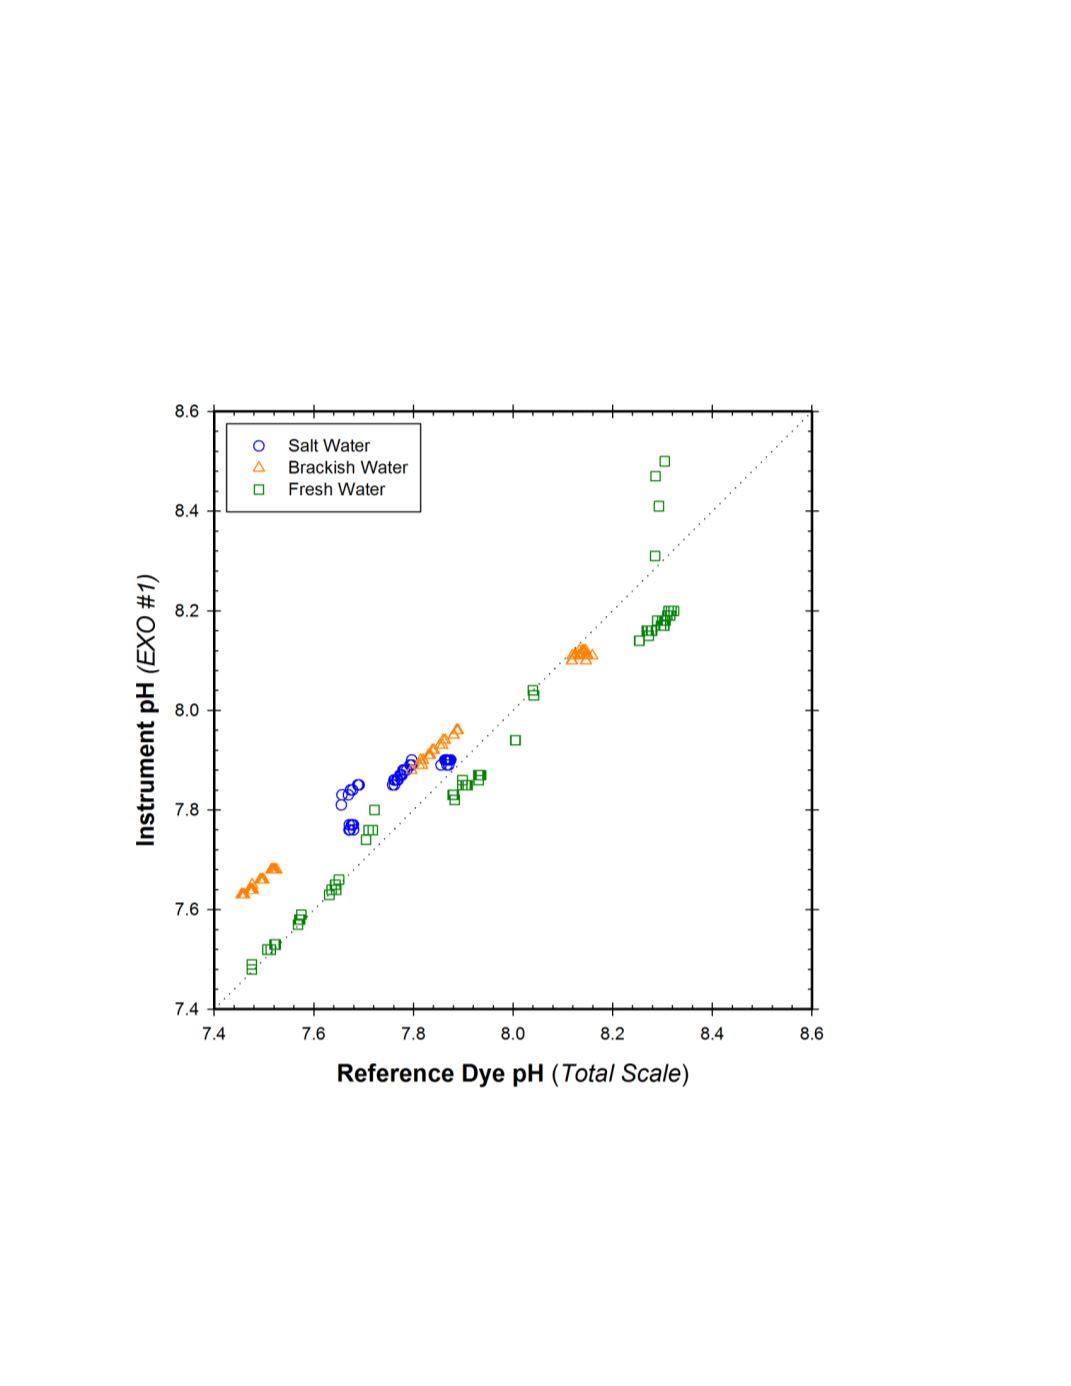
A cross plot of all corresponding EXO-pH1 versus reference pH results is shown in
figure 11. The instrument performance was slightly variable among water types with slopes and
regression coefficients ranging from 0.53 (r
2
=.75), 0.71 (r
2
= .99), and 0.88 (r
2
=0.94) for
seawater, brackish water, and freshwater tests respectively. The overall linear regression through
all of the data had a slope of 0.73 with an intercept of 2.17 (r
2
= 0.91). The mean and standard
deviation of the calculated difference between the EXO-pH1 measurement and the reference pH
for all matched pairs within the three stable testing periods was 0.04 ±0.09 (N=197).
Figure 11.
Cross plot of Xylem EXO-pH1 measurements against the dye reference pH measurements for
201 matched observations during the stable Temperature and Salinity portions of the entire lab test.