


 18 / 73

Ref. No. [UMCES] CBL 2015-014
ACT VS15-07
18
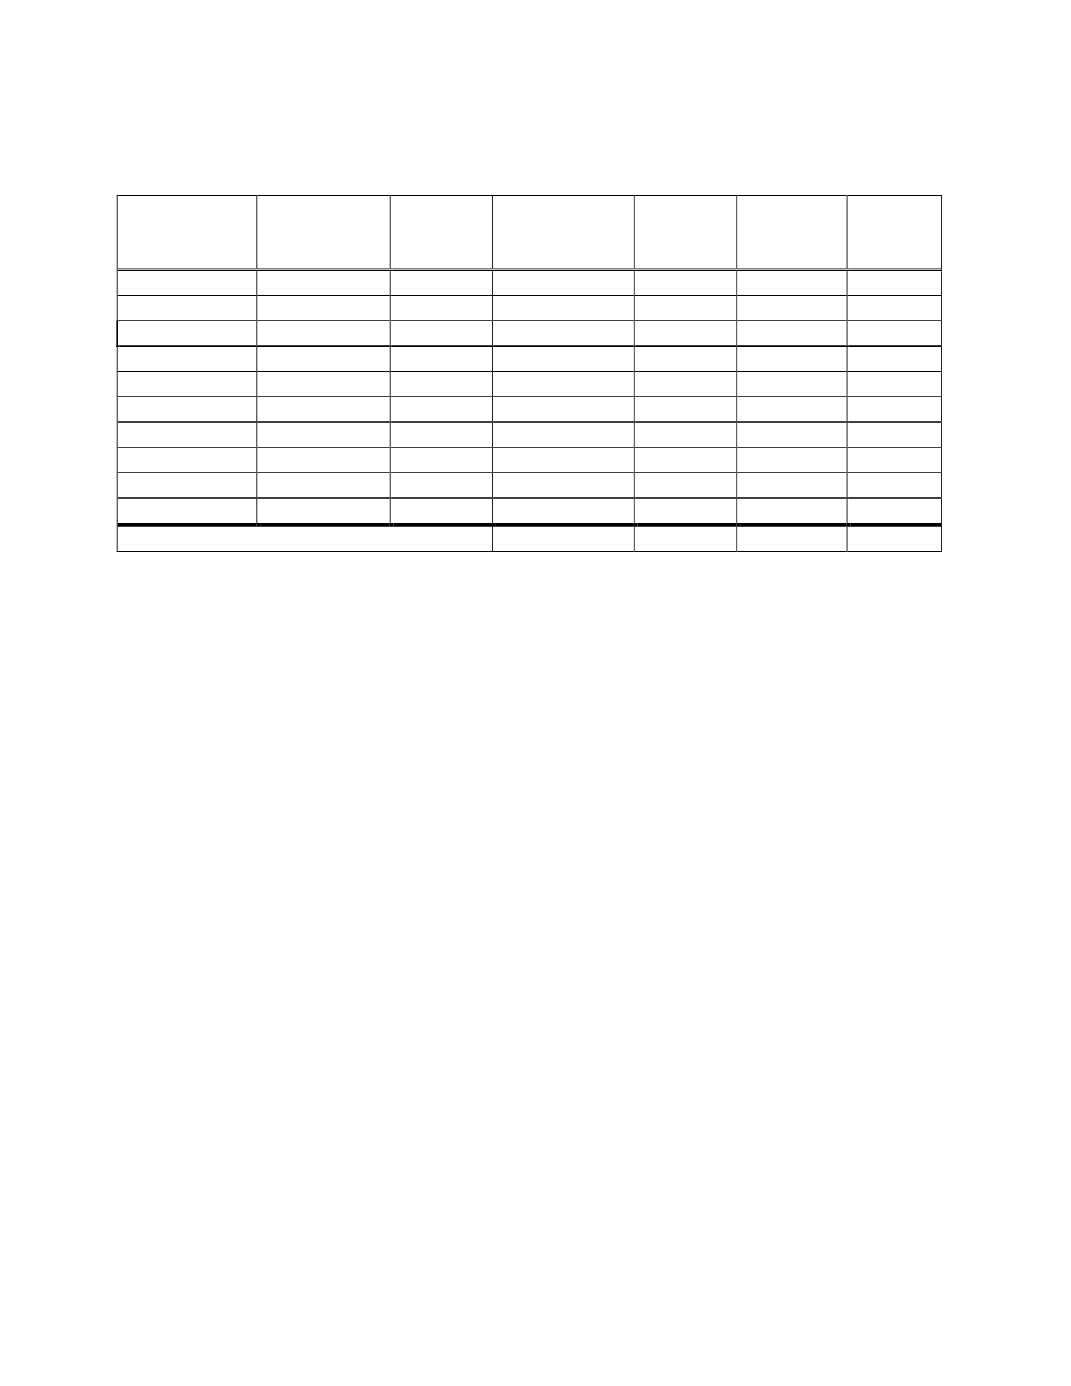
Table 1.
Results of burst sample analysis for the Lab Test to demonstrate consistency of test tank
conditions and repeatability of dye pH measurements.
Date
Measurement
Temperature
(
o
C)
Salinity
Time Interval
(min)
(# Obs)
Mean
Std Dev
CV
12/11/12
20.4
35
24 (n=5)
7.783
0.0021
0.026
12/15/12
20.7
35
10 (n=3)
7.762
0.0035
0.045
12/18/12
11.0
35
16 (n=4)
7.867
0.0017
0.022
1/4/13
29.8
22
8 (n=2)
7.973
0.0018
0.023
1/8/13
12.0
22
30 (n=5)
8.141
0.0055
0.068
1/15/13
20.5
22
29 (n=5)
7.860
0.0005
0.001
1/31/13
12.5
0.3
35 (n=5)
8.277
0.0054
0.065
2/6/13
20.4
0.3
65 (n=5)
7.881
0.0024
0.030
2/8/13
30.4
0.3
60 (n=5)
7.644
0.0013
0.018
2/12/13
25.5
34
39 (n=5)
7.934
0.0010
0.013
Overall Average
0.0025
0.032
The EXO sonde used in the lab test was equipped with two pH probes and their results
are presented in separate figures and are designated as EXO-pH1 and EXO-pH2. The complete
ten week time series for EXO-pH1 and corresponding reference pH results are shown in Fig. 3.
Although temperature and salinity were tightly controlled and the test tank received a single
batch of continuously circulated source water, the pH varied considerably during each of the
trials due to biological activity. These time series results also include the rapid pH shifts that
were conducted once a week under each of the test T/S conditions using acid/base additions.
Detailed plots of each pH transitions are provided in Appendix I. In general, pH was varied by
around 1.2 pH units during the acid/base additions and conditions maintained at each new value
for approximately an hour.
The EXO-pH1 operated continuously throughout the entire lab test and generated 6286
pH measurements at 15 minute intervals. The total range of pH measured by the EXO-pH1 was
7.04 to 8.50, compared to the range of our reference pH of 6.943 to 8.502. The EXO-pH1
measurements tracked changing pH conditions among all water sources and temperature ranges,
and consistently responded to the rapid pH shifts from acid/base additions. The average
difference between the EXO-pH1 and reference pH was 0.05 ±0.09 (N=266), with a total range
of -0.31 to 0.19. Initial instrument measurements conducted with the second seawater trial on
the tenth week exhibited a slightly higher offset (mean difference = 0.17 ±0.004; N=7) compared
to measurements from the first week (mean difference = 0.10 ± 0.004; N=28) (data not shown).