


 29 / 63

Ref. No. [UMCES] CBL 2015-013
ACT VS15-06
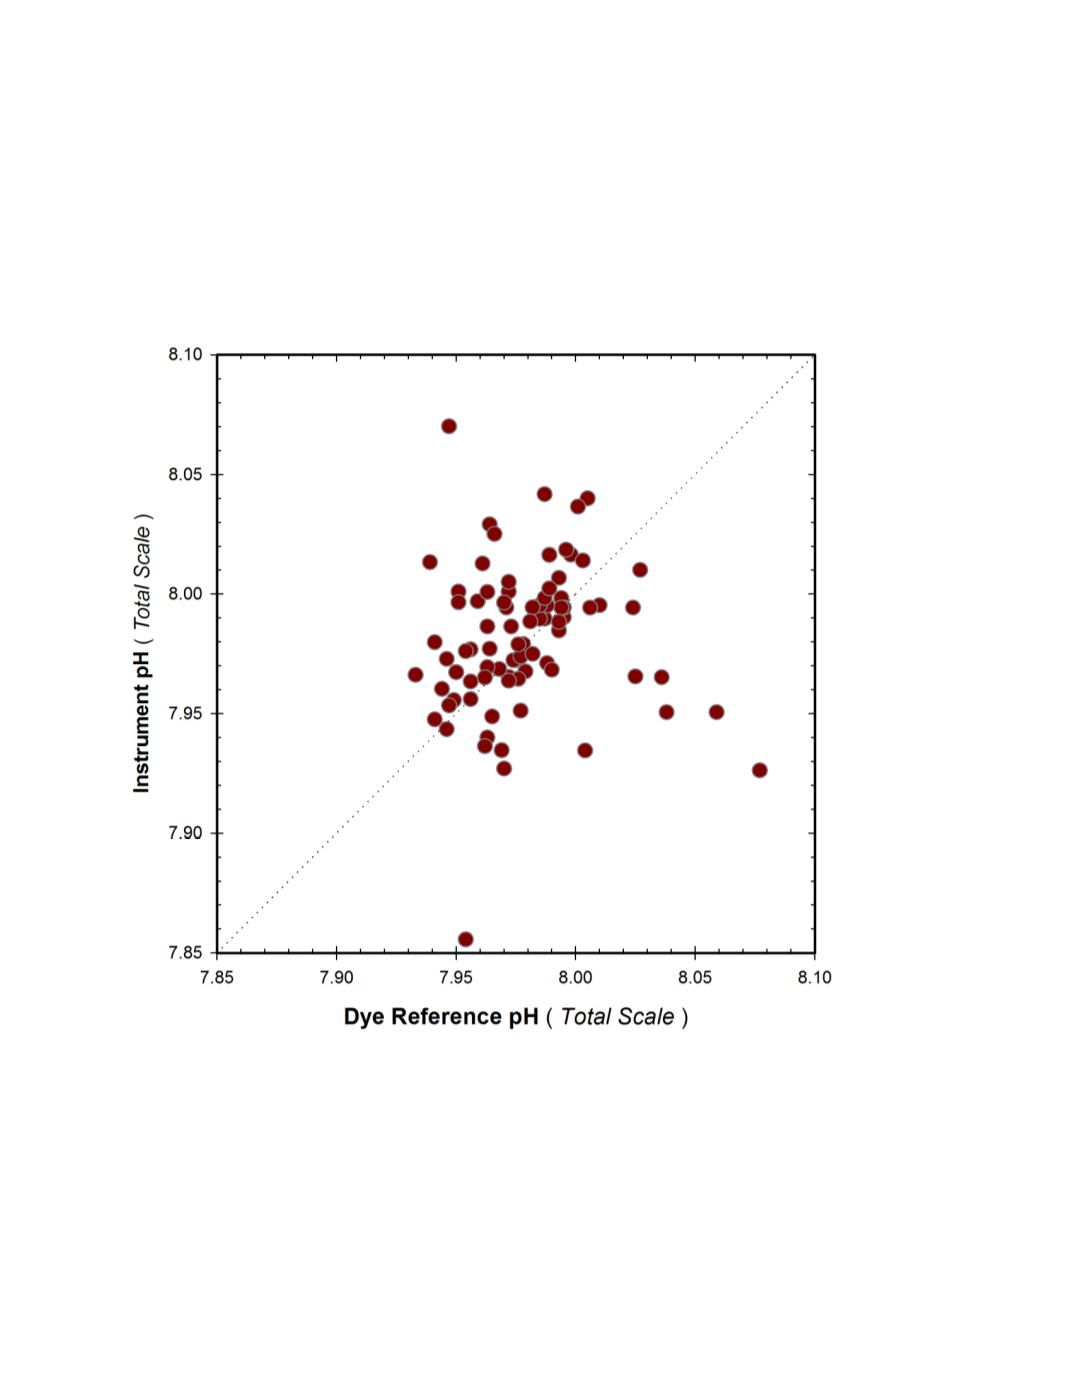
A cross-plot of the matched observations is given in figure 10. The regression was not
statistically significant (p=0.55, r
2
=0.004) and there was significant scatter around a fairly small
pH range within the observations. There were slightly more SAMI-pH observation below the
reference value (51) than above (33).
Figure 10.
MLML field response plot of a SAMI-pH(mCP) instrument compared to reference pH
Total
samples. Fine dotted line represents 1:1 correspondence, as pH
Total
scale is reported by the SAMI-pH
instrument and the dye reference method.
29