


 24 / 63

Ref. No. [UMCES] CBL 2015-013
ACT VS15-06
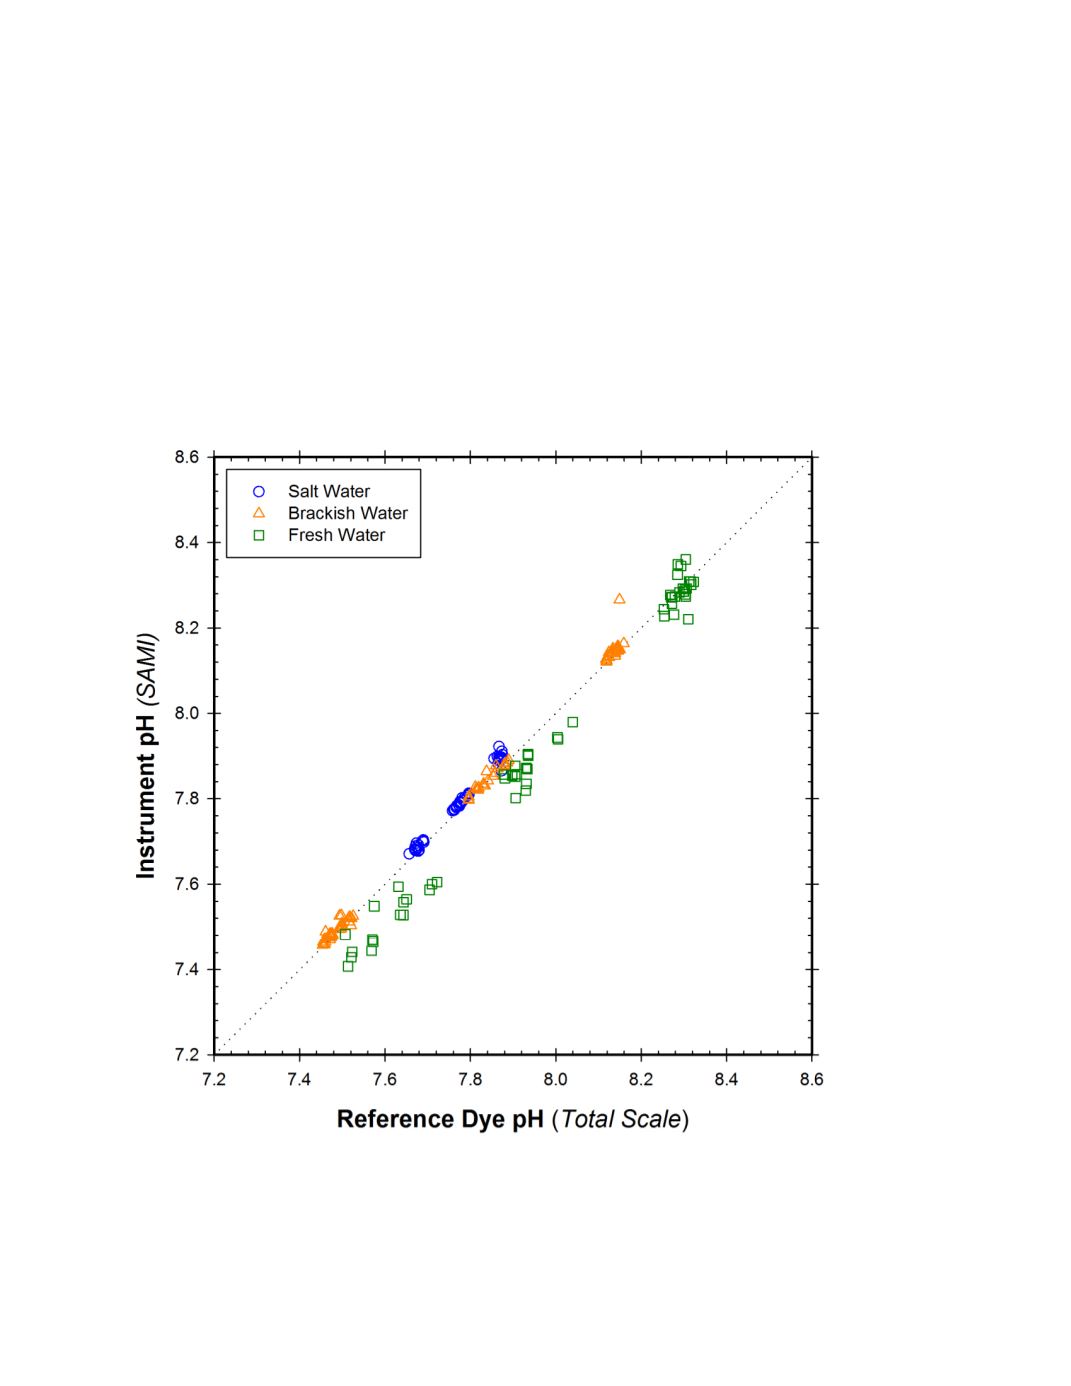
A cross plot of all corresponding SAMI-pH versus reference pH results in shown in
figure 7. Results from the SAMI-pH agreed closely over the entire test range of 7.4 to 8.3 pH.
The slopes and regression coefficients ranged from 1.082 (r
2
=.99), 1.183 (r
2
= .99), and 1.183
(r
2
=0.97) for seawater, brackish water, and freshwater tests respectively. The instrument
response factor was more variable for the freshwater trials, as may be expected with the use of
MetaCresol purple dye indicator for SAMI compared to Phenol Red for the reference samples.
The overall linear regression of the data had a slope of 1.037 with an r
2
of 0.96. The mean and
standard deviation of the calculated difference between the SAMI-pH measurement and the
reference pH for all matched pairs within the three stable testing periods was -0.010 ±0.058
(N=193).
Figure 7.
Cross plot of Sunburst Sami pH measurements against the dye reference pH measurements for
201 matched observations during the stable Temperature and Salinity portions of the entire lab test.
24