


 23 / 63

Ref. No. [UMCES] CBL 2015-013
ACT VS15-06
A.
B.
C.
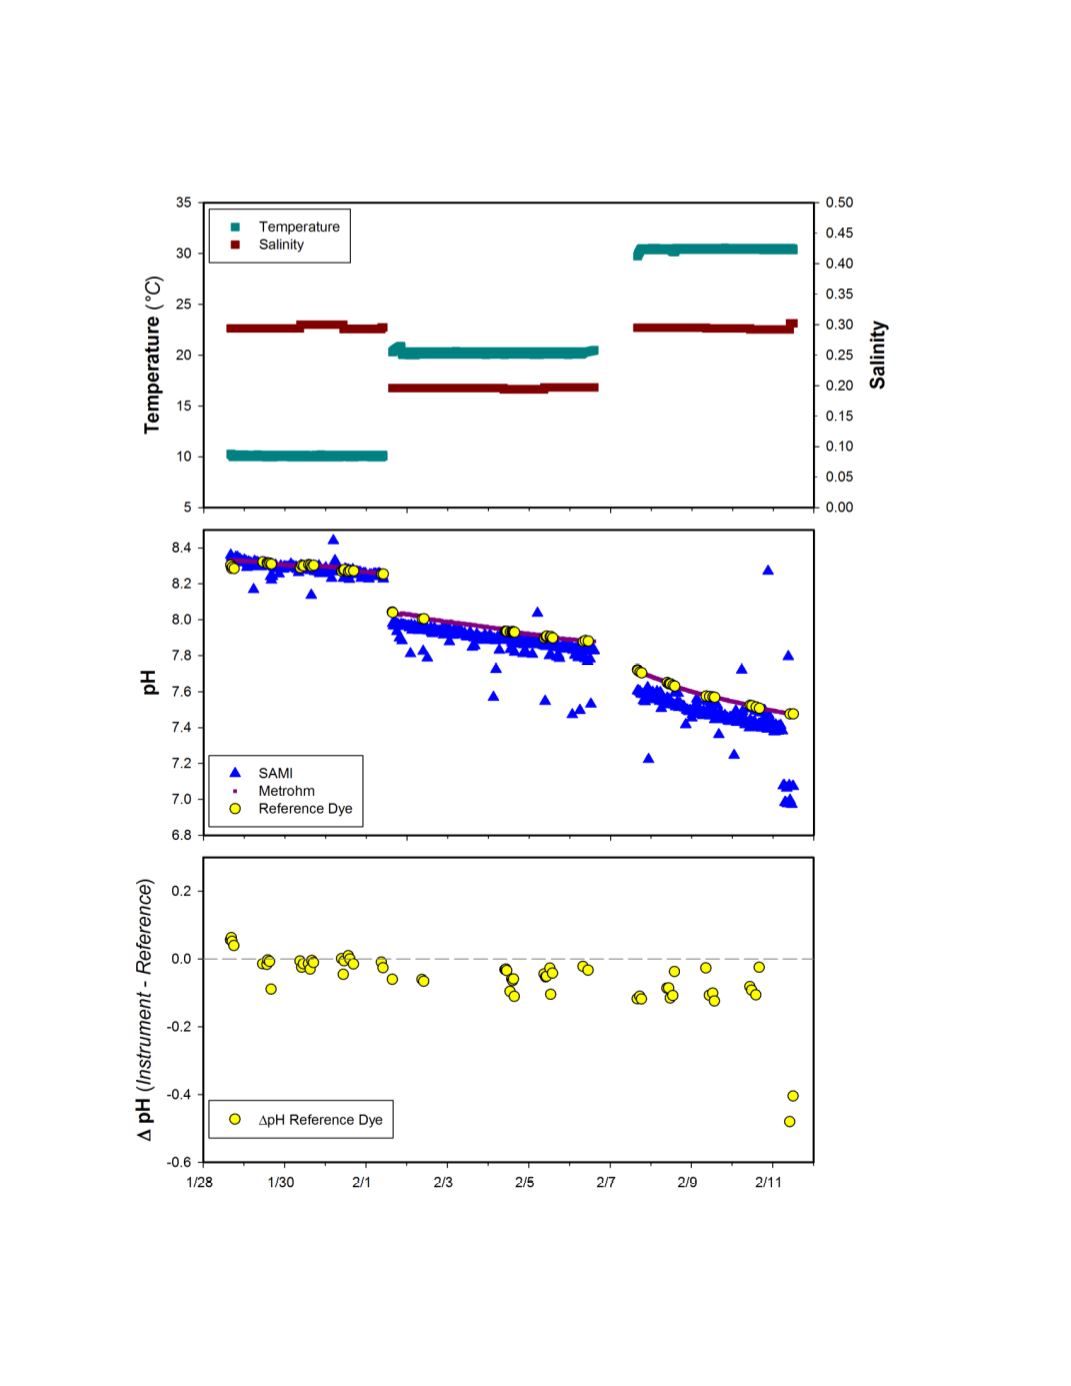
Figure 6.
Time series results of the Sunburst Sami pH sensor for the stable portion of the
freshwater trials. Measurements taken during temperature and pH shifts have been removed.
Panel (a) temperature and salinity conditions during the seawater trials; panel (b) measured pH
from the Sunburst Sami pH plotted against both Metrohm and Dye reference pH
measurements; and, panel (c) the difference between Sunburst and reference pH values.
23