


 18 / 63

Ref. No. [UMCES] CBL 2015-013
ACT VS15-06
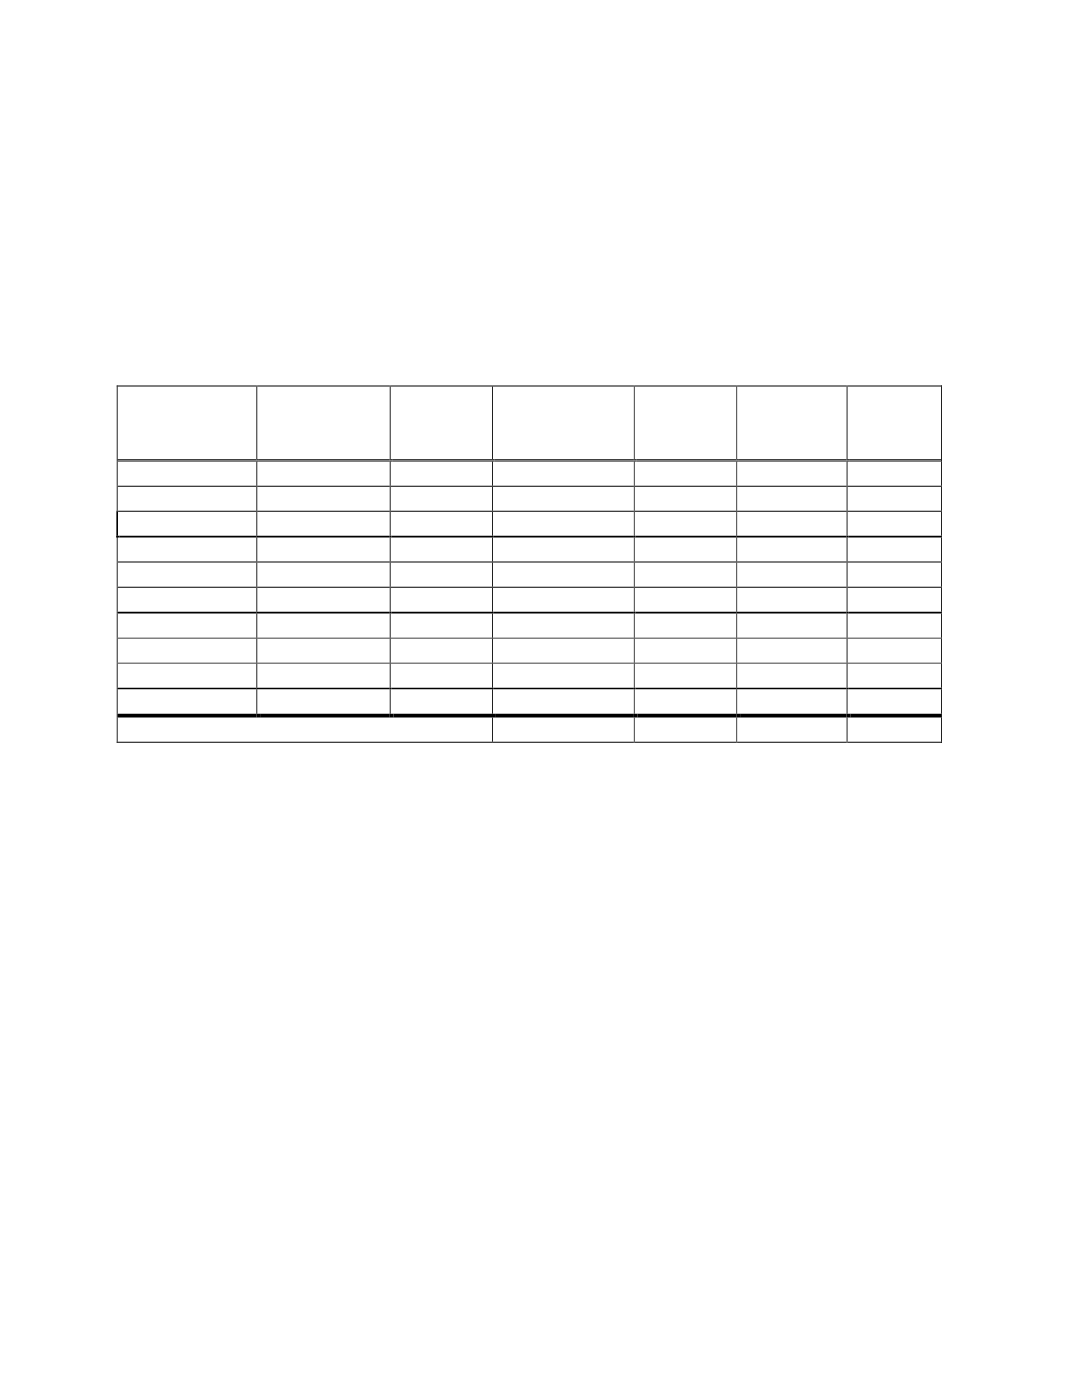
Once a week multiple reference samples were collected from the test tank in a burst, i.e.
sampled as rapidly as possible to examine heterogeneity within the test tank and repeatability of
the reference pH results. The average standard deviation of the reference pH value for ten
sampling events was 0.0025 with a range of 0.0055 to 0.0005 (Table 1).
Table 1.
Results of burst sample analysis for the Lab Test to demonstrate consistency of test tank
conditions and repeatability of dye pH measurements.
Date
Measurement
Temperature
(
o
C)
Salinity
Time Interval
(min)
(# Obs)
Mean
Std Dev
CV
12/11/12
20.4
35
24 (n=5)
7.783
0.0021
0.026
12/15/12
20.7
35
10 (n=3)
7.762
0.0035
0.045
12/18/12
11.0
35
16 (n=4)
7.867
0.0017
0.022
1/4/13
29.8
22
8 (n=2)
7.973
0.0018
0.023
1/8/13
12.0
22
30 (n=5)
8.141
0.0055
0.068
1/15/13
20.5
22
29 (n=5)
7.860
0.0005
0.001
1/31/13
12.5
0.3
35 (n=5)
8.277
0.0054
0.065
2/6/13
20.4
0.3
65 (n=5)
7.881
0.0024
0.030
2/8/13
30.4
0.3
60 (n=5)
7.644
0.0013
0.018
2/12/13
25.5
34
39 (n=5)
7.934
0.0010
0.013
Overall Average
0.0025
0.032
The complete ten week time series for the SAMI-pH and corresponding reference pH
results are shown in Fig. 3. Although temperature and salinity were tightly controlled and the
test tank received a single batch of continuously circulated source water, the pH varied
considerably during each of the trials due to biological activity. These time series results also
include the rapid pH shifts that were conducted once a week under each of the test T/S
conditions using acid/base additions. Detailed plots of each pH transitions are provided in
Appendix I. In general, pH was varied by around 1.2 pH units during the acid/base additions and
conditions maintained at each new value for approximately an hour.
The SAMI-pH operated continuously throughout the entire lab test and generated 3140
useable measurements out of a total possibility of 3154 timepoints. The total range of pH
measured by the SAMI-pH was 6.273 to 8.441, compared to the range of our discrete reference
samples of 6.943 to 8.502. The SAMI-pH showed some differences in accuracy across the
various test solutions and pH ranges, as would be expected based on the specific set-up of the
instrument in terms of the indicator dye used and its operational range. For the complete Lab
test, the mean of the differences between the SAMI-pH measurement and reference pH was -
0.017 ±0.970 (N=263), with a total range of -1.159 to 0.140. The larger offsets only occurred
during the rapid pH shifts (see Appendix 1 and Stable Periods section below). Instrument
measurements conducted at ten weeks with the second seawater trial exhibited a similar level of
18