


 24 / 58

Ref. No. [UMCES] CBL 2015-011
ACT VS15-04
24
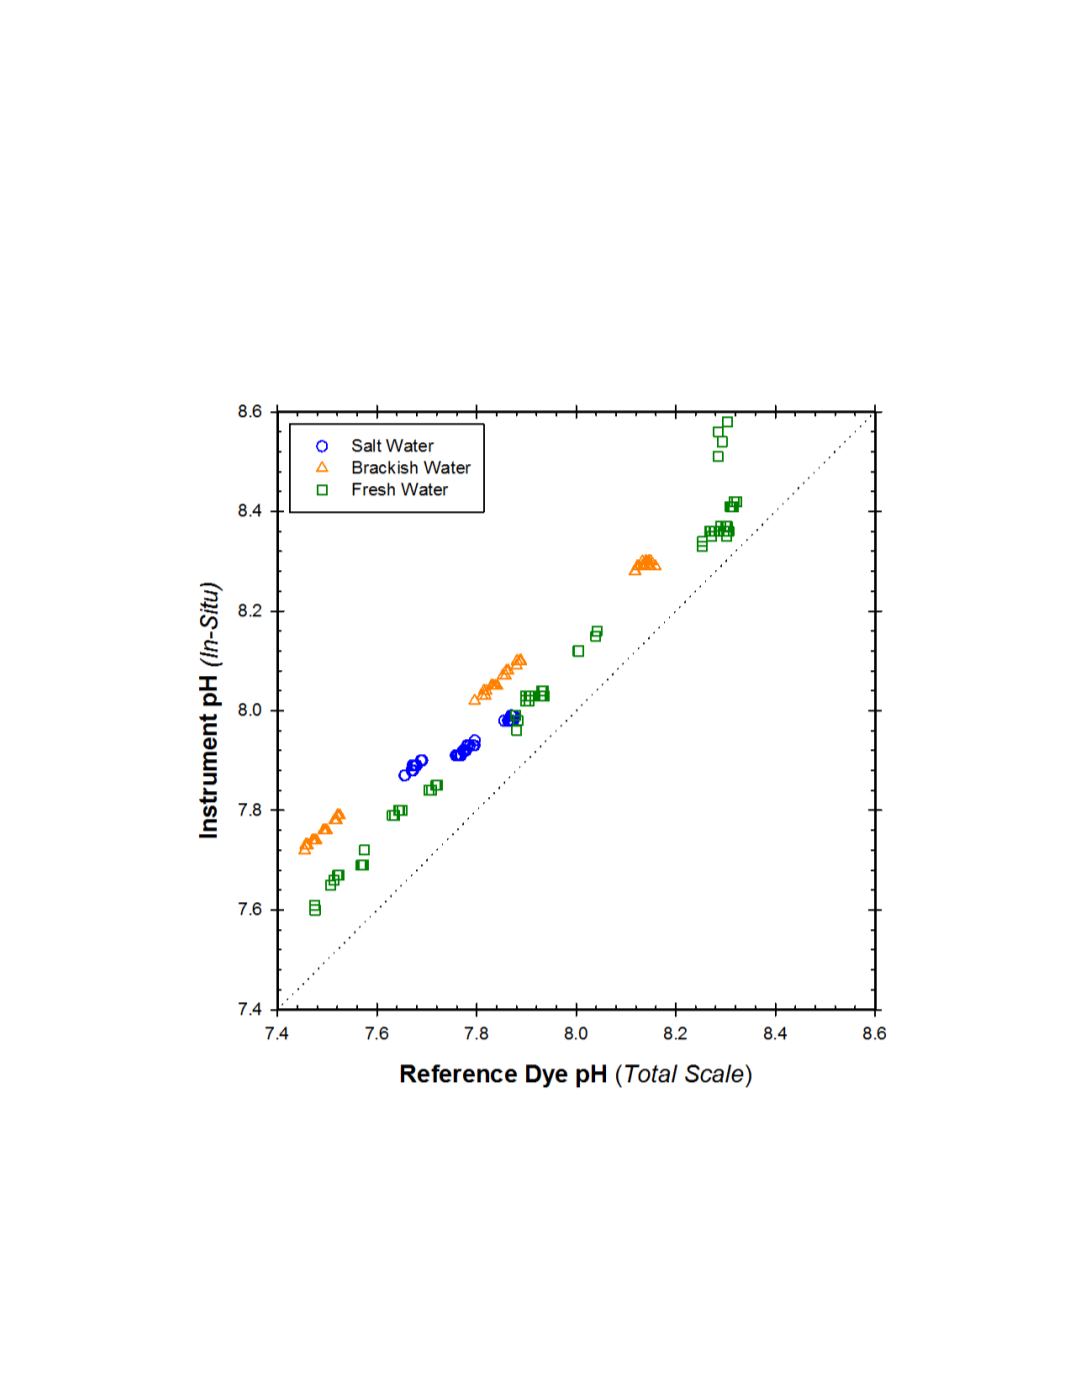
A cross plot of all corresponding Troll 9500 versus reference pH results in shown in
figure 7. The instrument response factor was variable among water types but with consistently
high regression coefficients when plotted against dye reference pH. The slopes and regression
coefficients ranged from 0.49 (r
2
=.94), 0.83 (r
2
= .99), and 0.96 (r
2
=0.98) for seawater, brackish
water, and freshwater tests respectively. The overall linear regression through all of the data had
a slope of 0.85 with an intercept of 1.3 (r
2
= 0.95). The mean and standard deviation of the
calculated difference between the Troll 9500 measurement and the reference pH for all matched
pairs within the three stable testing periods was 0.17 ±0.06 (N=197), which was nearly identical
to that for the complete lab test.
Figure 7.
Cross plot of Troll 9500 pH sensor measurements against the dye reference pH measurements
for 201 matched observations during the stable Temperature and Salinity portions of the entire lab test.