


 20 / 58


Ref. No. [UMCES] CBL 2015-011
ACT VS15-04
20
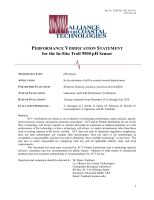
During the brackish water trials, salinity was maintained to within 0.11 units (range =
21.75 to 21.86) with an average of 21.80 and temperature was maintained to within 0.7
o
C for
each set point (Fig. 5 top). The first temperature trial ranged from 9.95 to 10.67
o
C, with an
average of 10.09
o
C, the second temperature trial ranged from 20.02 to 20.40
o
C, with an average
of 20.20
o
C, and the third temperature trial ranged from 30.18 to 30.54
o
C, with an average of
30.43
o
C. Time series results of the Troll 9500, Metrohm data and reference pH data are shown
in THE middle panel and the time series of the calculated difference between instrument and
reference pH are shown in the bottom panel. The average difference between the Troll 9500 and
reference pH for the brackish water component was 0.22 ± 0.05, with a total range of 0.13 to
0.27 (N=76).
During the freshwater trials, salinity was maintained to within 0.11 units (range = 0.19 to
0.30) with an average of 0.26 and temperature to within 0.9
o
C for each set point (Fig. 6 top).
The first temperature trial ranged from 9.96 to 10.28
o
C, with an average of 10.08
o
C, the second
temperature trial ranged from 20.00 to 20.91
o
C, with an average of 20.22
o
C, and the third
temperature trial ranged from 29.73 to 30.55
o
C, with an average of 30.42
o
C. Time series results
of the Troll 9500, Metrohm data and reference pH data are shown in middle panel and the time
series of the calculated difference between instrument and reference pH are shown in the bottom
panel. The average difference between the Troll 9500 and reference pH for the freshwater
component was 0.12 ± 0.05, with a total range of 0.05 to 0.28 (N=62).