


 19 / 47

Ref. No. [UMCES] CBL 2015-009
ACT VS15-02
19
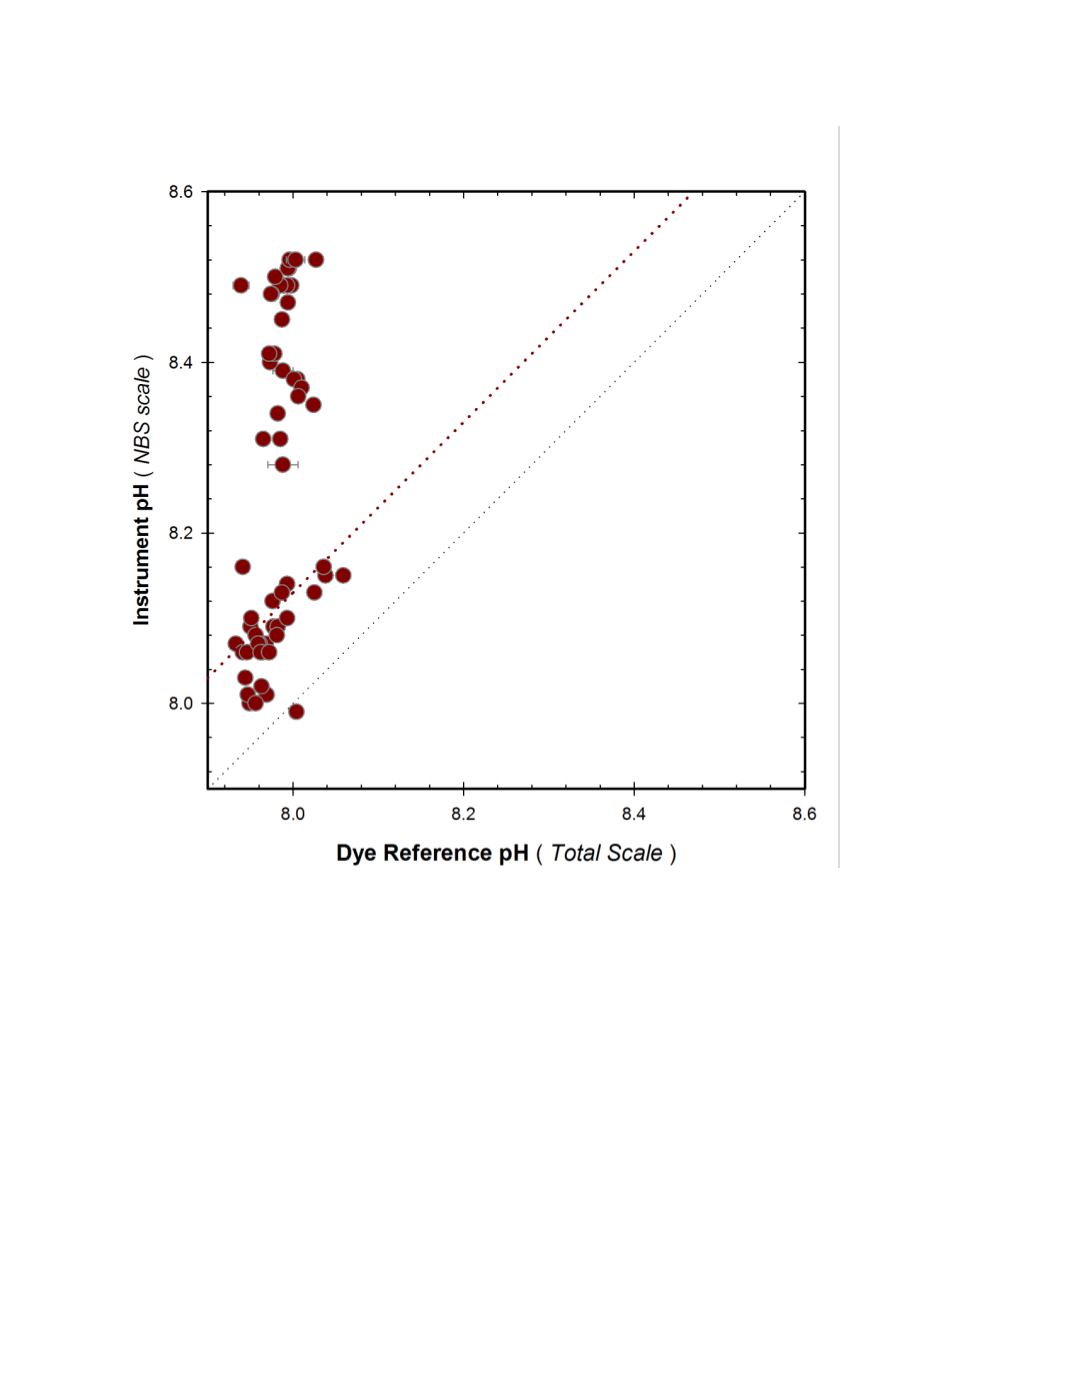
Figure 3.
MLML field response plot of Manta2 pH sensor deployed with antifouling copper screen
compared to reference pH
Total
samples. Fine dotted line represents 1:1 correspondence, coarse dotted line
represents correspondence predicted based on difference between pH
NBS
and pH
Total
in seawater (pH
NBS
=
pH
Total
+ 0.13).