


 45 / 60

Ref. No. [UMCES] CBL 2016-016
ACT VS16-07
45
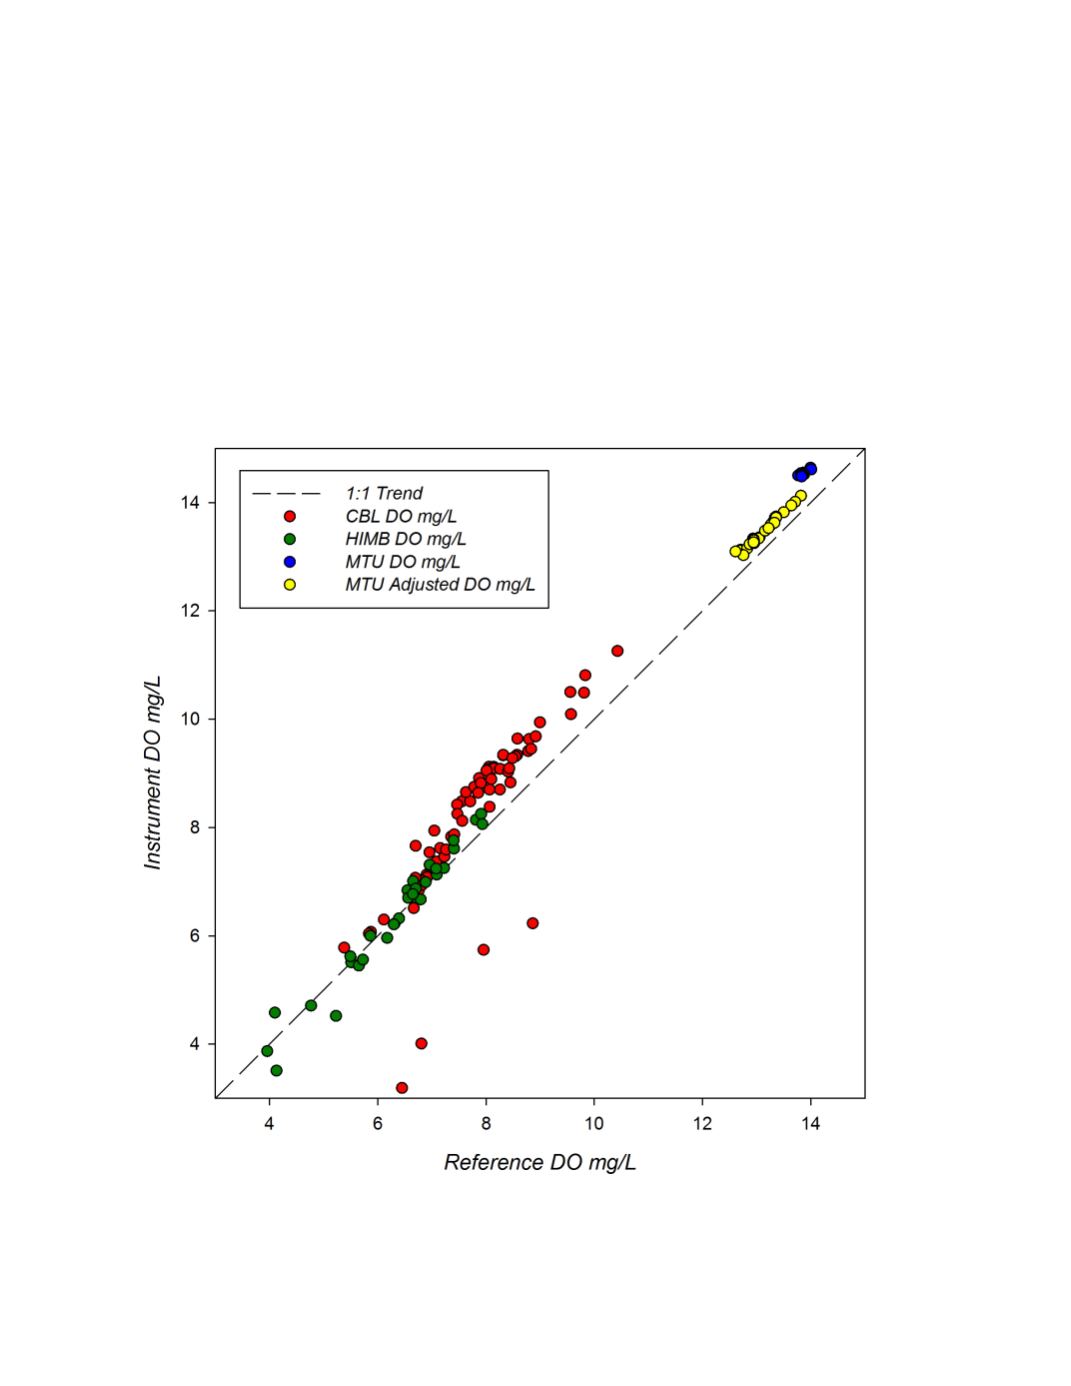
A global summary of instrument versus reference readings for all three field deployment
sites are plotted in figure 10. The Troll 9000 response showed good linearity across all three
salinity ranges including freshwater, brackish water, and oceanic water, but with some slight
differences in the slopes of the response curves for each source water as noted above. The
accuracy of the response curve was reasonably consistent across the concentration range within a
given test site when operational, and relatively consistent over the wide range of DO conditions (4
- 14 mg/L) across sites. The overall variability was higher for the oceanic test in Kaneohe Bay
likely due to an internal problem within the instrument which ultimately caused it to fail. A linear
regression of the composited data (r
2
= 0.963; p<0.0001)) had a slope of 1.086 and intercept of
-0.351.
Figure 10.
Global response plot for the Troll 9000 instruments observed during the three ACT field trials.
Black dotted line represents a 1:1 correspondence.