


 18 / 57

Ref. No. [UMCES] CBL 2015-010
ACT VS15-03
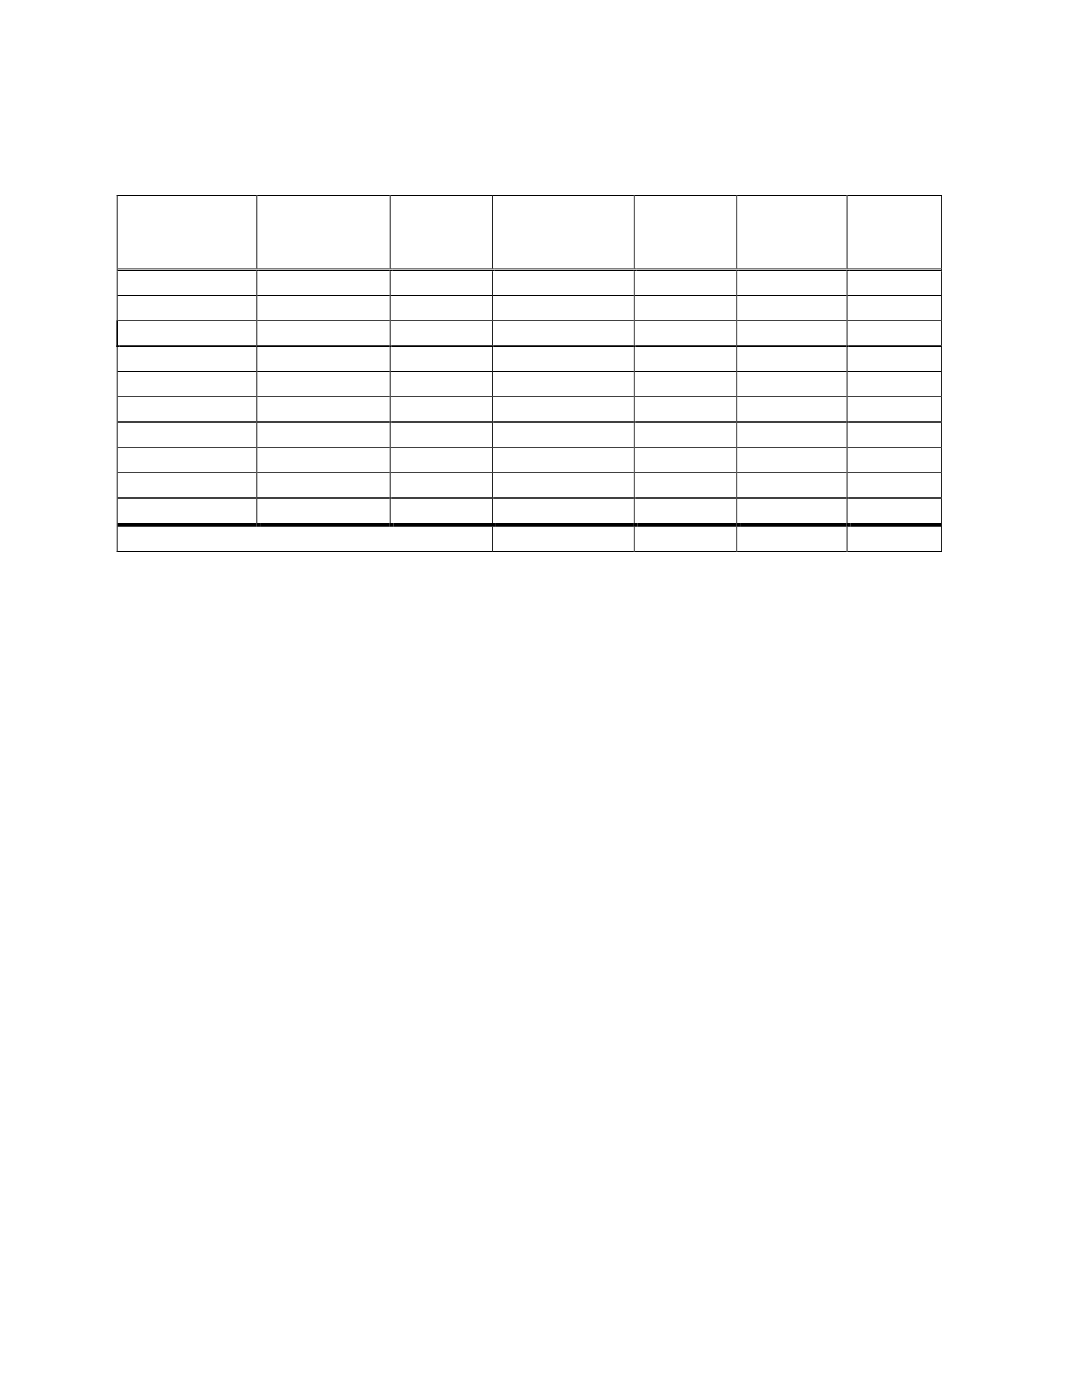
Table 1.
Results of burst sample analysis for the Lab Test to demonstrate consistency of test tank
conditions and repeatability of dye pH measurements.
Date
Measurement
Temperature
(
o
C)
Salinity
Time Interval
(min)
(# Obs)
Mean
Std Dev
CV
12/11/12
20.4
35
24 (n=5)
7.783
0.0021
0.026
12/15/12
20.7
35
10 (n=3)
7.762
0.0035
0.045
12/18/12
11.0
35
16 (n=4)
7.867
0.0017
0.022
1/4/13
29.8
22
8 (n=2)
7.973
0.0018
0.023
1/8/13
12.0
22
30 (n=5)
8.141
0.0055
0.068
1/15/13
20.5
22
29 (n=5)
7.860
0.0005
0.001
1/31/13
12.5
0.3
35 (n=5)
8.277
0.0054
0.065
2/6/13
20.4
0.3
65 (n=5)
7.881
0.0024
0.030
2/8/13
30.4
0.3
60 (n=5)
7.644
0.0013
0.018
2/12/13
25.5
34
39 (n=5)
7.934
0.0010
0.013
Overall Average
0.0025
0.032
The complete ten week time series for the Idronaut Ocean Seven 305 Plus pH sensor and
corresponding reference pH results are shown in Fig. 3. Although temperature and salinity were
tightly controlled and the test tank received a single batch of continuously circulated source
water, the pH varied considerably during each of the trials due to biological activity. These time
series results also include the rapid pH shifts that were conducted once a week under each of the
test T/S conditions using acid/base additions. Detailed plots of each pH transitions are provided
in Appendix A. In general, pH was varied by around 1.2 pH units during the acid/base additions
and conditions maintained at each new value for approximately an hour.
The Idronaut 305 Plus was not operating at the start of the laboratory deployment on
December 6
th
due to a battery short, but the error was not discovered and corrected until January
13
th
, which was about 6 days into the second trial using brackish water test. Because no seawater
results were obtained during the original trial a brief additional seawater exposure test was
performed at the end of the lab study. After restarting the instrument it operated continuously for
the next 33 days and generated 3162 pH measurements at 15 minute intervals. The total range of
pH measured by the Idronaut 305 Plus was 6.899 to 8.276, compared to the range of our
reference pH of 6.943 to 8.502. The Idronaut 305 Plus measurements tracked changing pH
conditions among all water sources and temperature ranges including the rapid pH shifts from
acid/base additions, but the magnitude and direction of the offset changed for each water type
(Fig.3). The mean of the differences between the Idronaut measurement and reference pH over
the entire lab test was -0.144 ±0.174 (N=181), with a total range of -0.502 to 0.078.
18