


 23 / 57

Ref. No. [UMCES] CBL 2015-010
ACT VS15-03
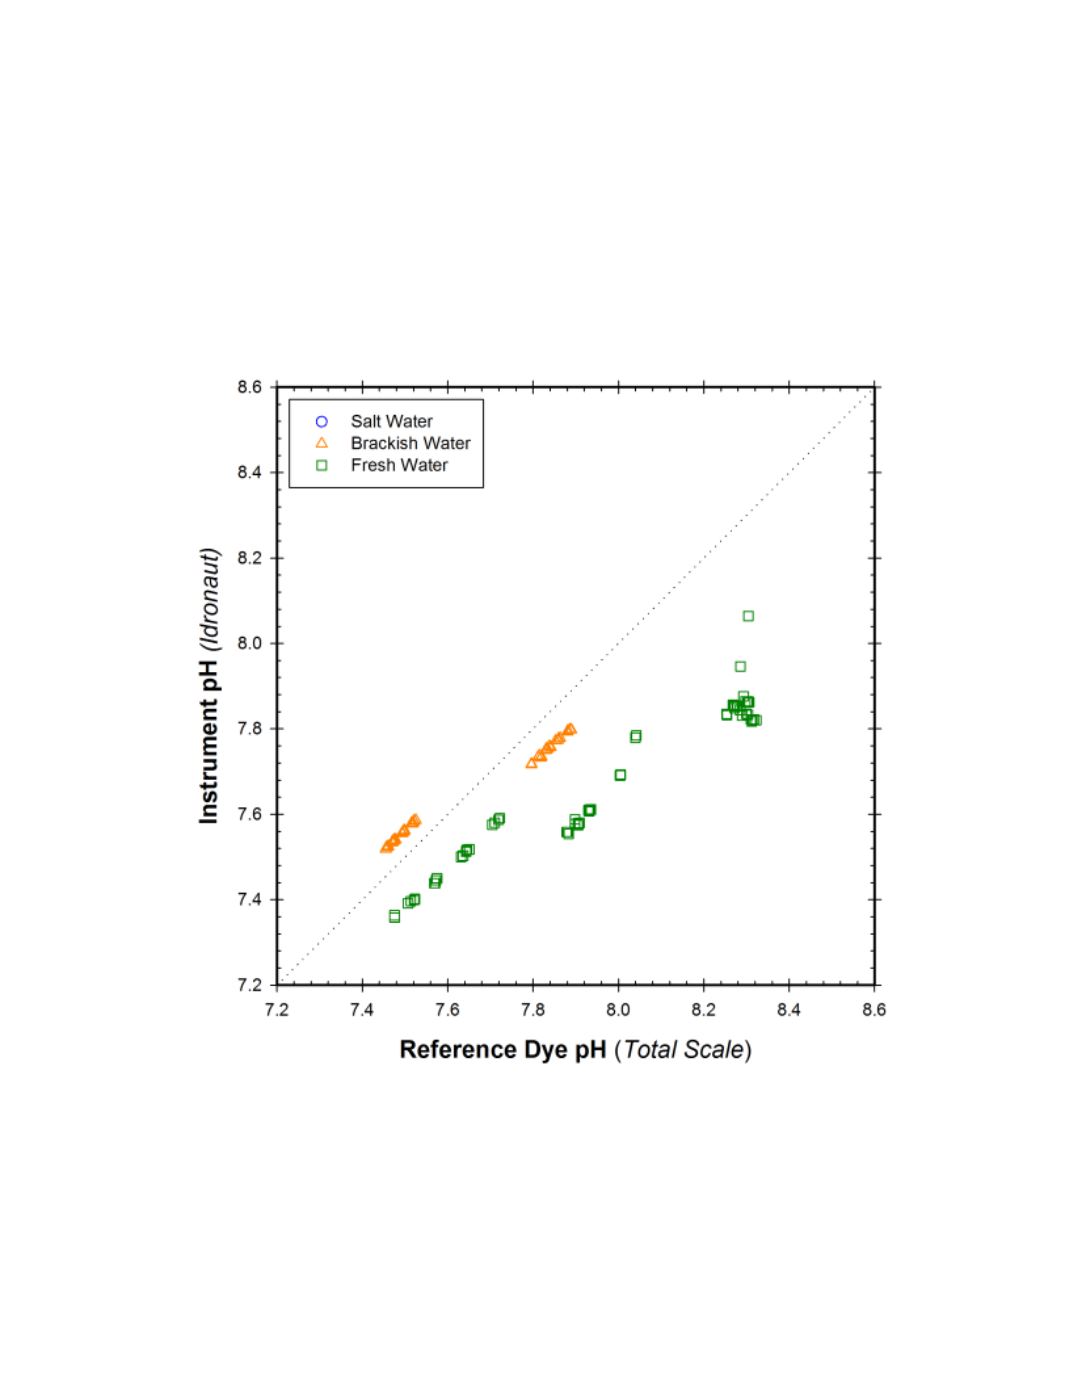
A cross plot of all corresponding Idronaut 305 Plus versus reference pH results for the
stable period is shown in figure 6. The slopes and regression coefficients ranged from 0.60 (r
2
=
.99), and 0.57 (r
2
=0.93) for the brackish water and freshwater tests respectively. The overall
linear regression through the two stable periods had an r
2
= 0.73 with a slope of 0.42 with an
intercept of 4.35. The mean and standard deviation of the calculated difference between the
305 Plus measurement and the reference pH for all matched pairs within the two stable testing
periods was -0.163 ±0.190 (N=115).
Figure 6.
Cross plot of Idronaut 305 Plus pH sensor measurements against the dye reference pH
measurements for 201 matched observations during the stable Temperature and Salinity portions of the
entire lab test.
23