


 17 / 57

Ref. No. [UMCES] CBL 2015-010
ACT VS15-03
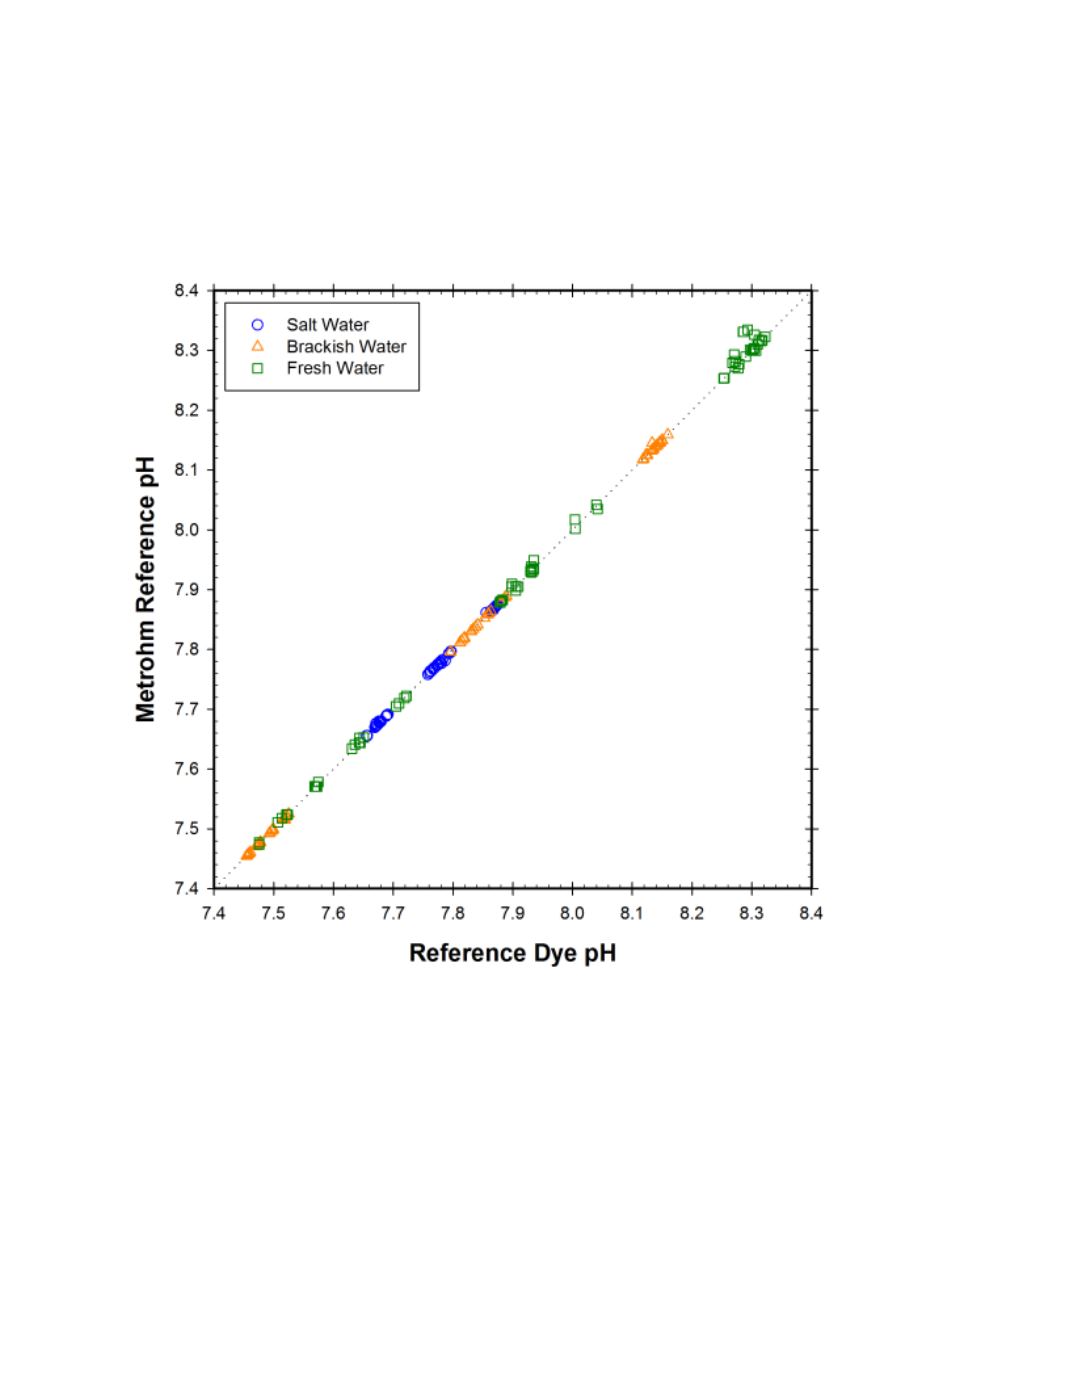
the data has a slope of 1.006 with an r
2
= 0.999. Metrohm results are included within some of
the time series plots below to provide a more continuous record of test conditions, but no
quantification of instrument accuracy was conducted with these data.
Figure 2.
Cross plot of matched Metrohm pH results that measured continuously within the test tank at
15 minute intervals versus dye measured reference pH results. Three-hundred, fifty-one dye based pH
measurements were made over the ten week test.
Once a week multiple reference samples were collected from the test tank in a burst, i.e.
sampled as rapidly as possible to examine heterogeneity within the test tank and repeatability of
the reference pH results. The average standard deviation of the reference pH value for ten
sampling events was 0.0025 with a range of 0.0055 to 0.0005 (Table 1).
17