


 32 / 59

Ref. No. [UMCES] CBL 2016-011
ACT VS16-02
32
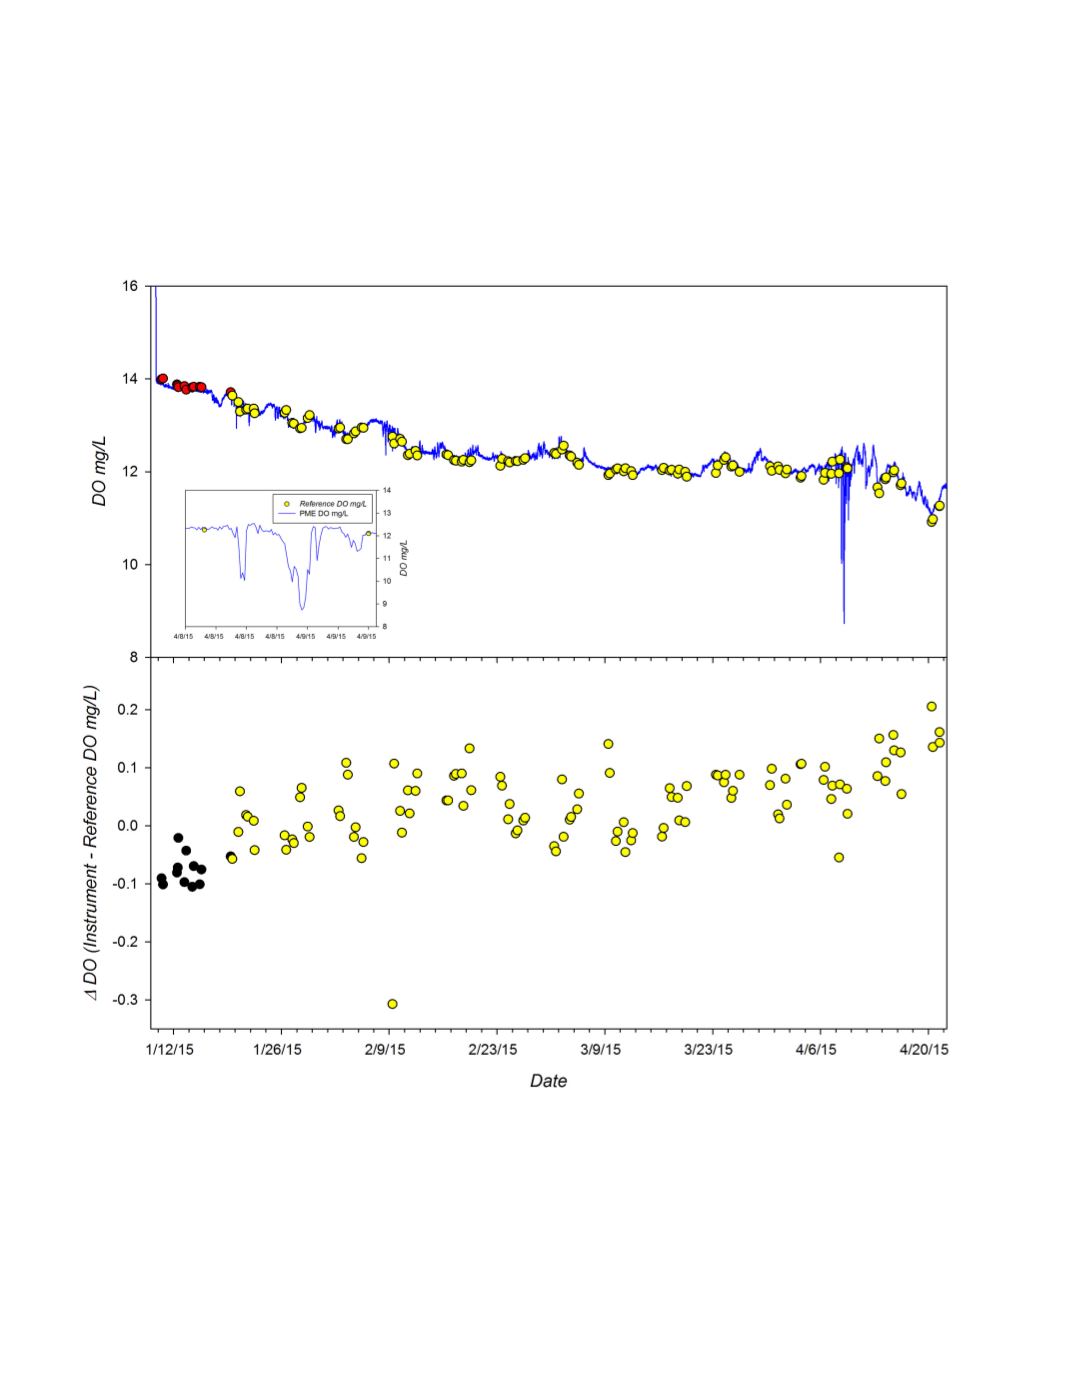
The time series of the difference between instrument and reference DO measurements for
each matched pair (n=118 observations) is given in the bottom panel of figure 2. The average and
standard deviation of the measurement difference over the total deployment was 0.029 ± 0.072
mg/L with a total range of -0.307 to 0.205mg/L. The drift rate of instrument offset, estimated by
linear regression (r
2
=0.373; p<0.0001), was 0.001 mg/L/d. This rate would include any biofouling
effects as well as any electronic or calibration drift.
Figure 2.
Time series of DO measured dete
c
ted by PME miniDOT deployed during the 15 week Great
Lakes field trial.
Top Panel
: Continuous DO recordings from instrument (blue line) and DO of adjacent
grab samples determined by Winkler titration (red circles and yellow circles for adjusted Winkler results
due to corrections across reagent batches).
Bottom Panel
: Difference in measured DO relative to reference
samples (Instrument DO mg/L – Reference DO mg/L) observed during deployment.
Insert:
Close up of
excursion that occurred 4/8-4/9. No reference samples were collected during this time period.