


 31 / 59

Ref. No. [UMCES] CBL 2016-011
ACT VS16-02
31
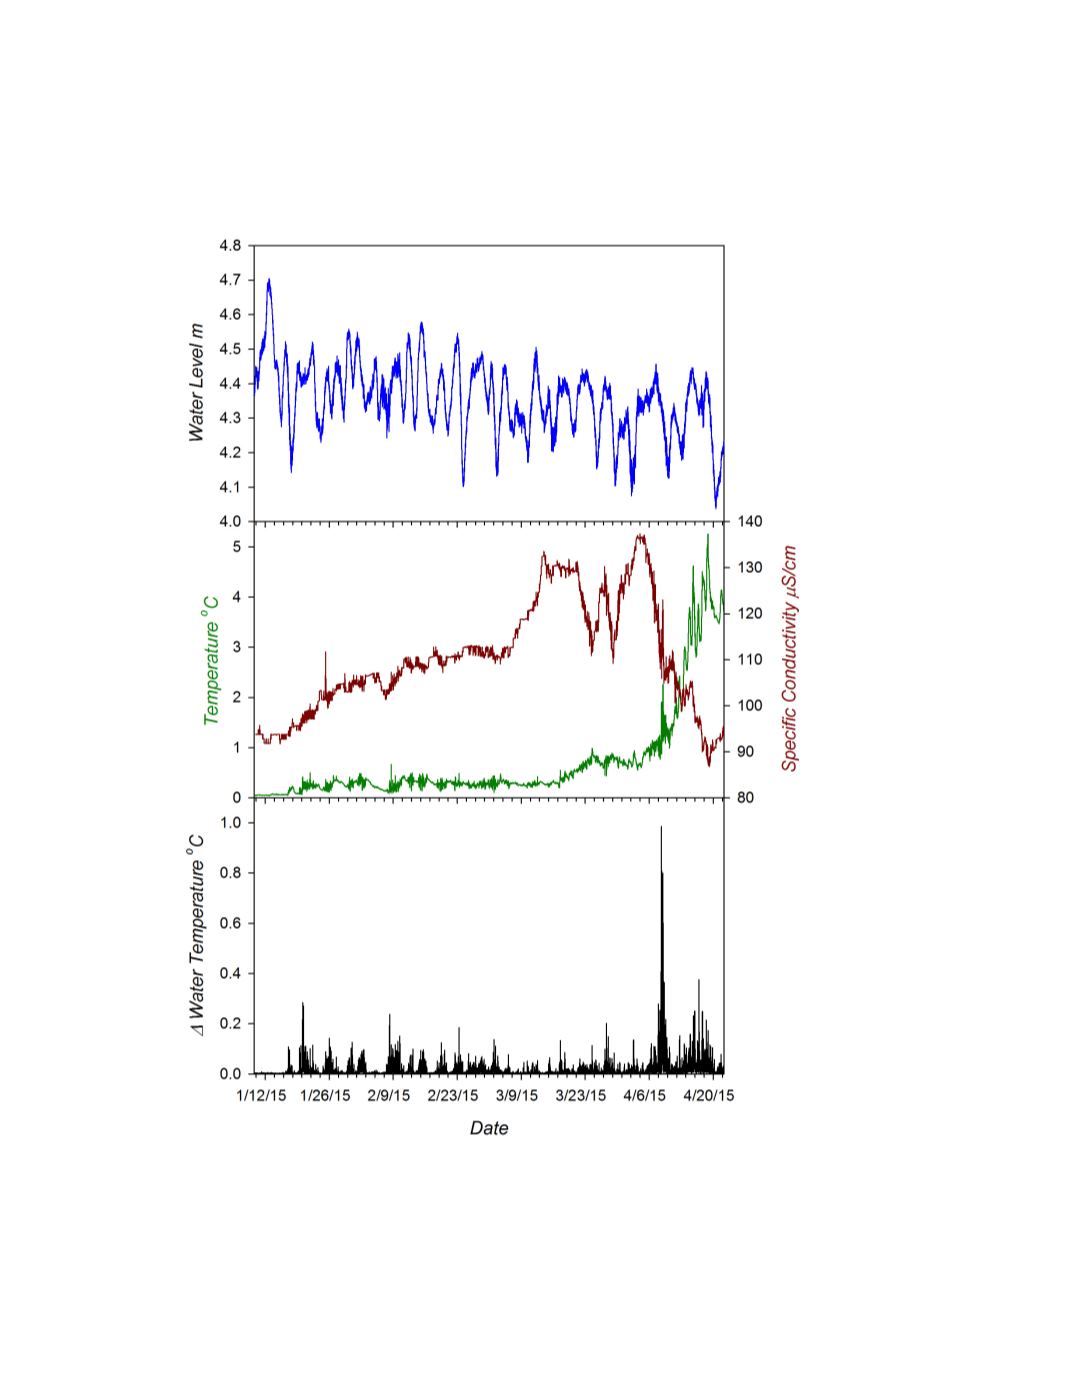
measured by the PME ranged from 8.73 to 16.53 mg/L compared to the range captured by
reference samples of 10.249 to 14.007 mg/L. The sharp excursion between April 8 - 9 was real and
was picked up by all instruments and correspondingly seen in specific conductance and
temperature variability across the instrument rack (Fig. 1).
Figure 1.
Environmental conditions encountered during deployment at the MTU site. Test sensor array deployed at 4.5 m
fixed depth, variation in local water levels indicate active water flow around instruments (
Top Panel
). Variation in specific
conductivity (red) and temperature (green) at depth of instrument sensor detected by an SBE 26 and two RBR Solo
thermistors (
Middle Panel
). Temperature range determined from max-min temperatures detected by 4 RBR thermistors
spanning instrument sensor array (
Bottom Panel
).