


 57 / 73

Ref. No. [UMCES] CBL 2015-014
ACT VS15-07
57
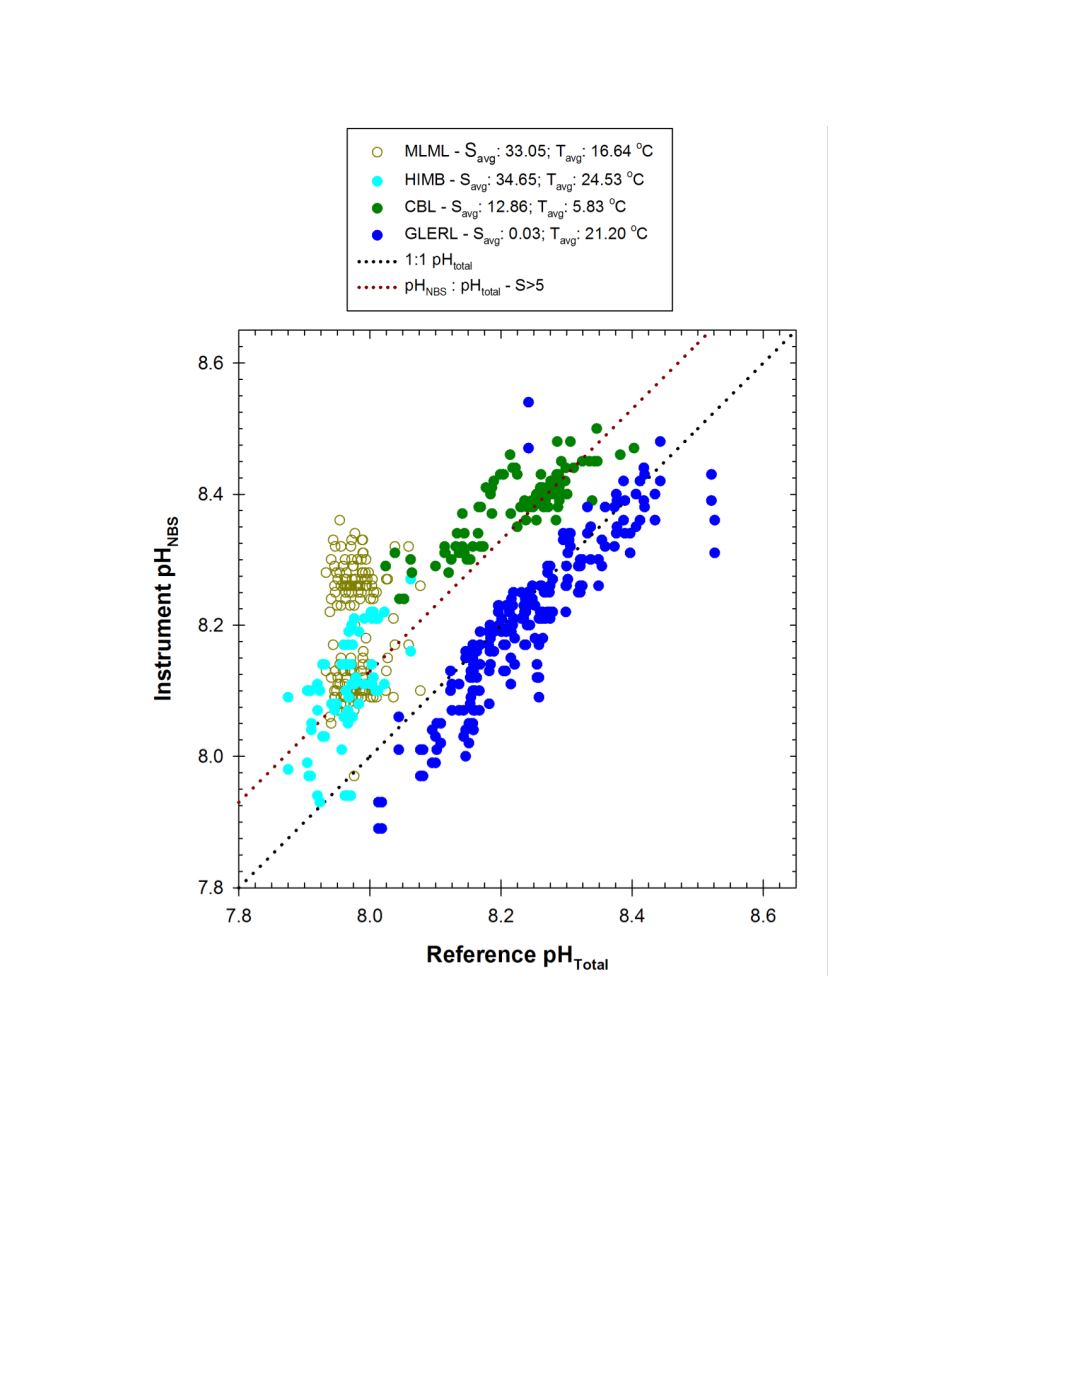
Figure 31.
Global response plot for all of the Xylem EXO pH sensors deployed during ACT field trials.
Black dotted line represents 1:1 equivalence of scales expected in freshwater, dark red dotted line
represents correspondence predicted based on difference between pH
NBS
and pH
Total
in seawater (pH
NBS
=
pH
Total
+ 0.13).