


 55 / 73

Ref. No. [UMCES] CBL 2015-014
ACT VS15-07
55
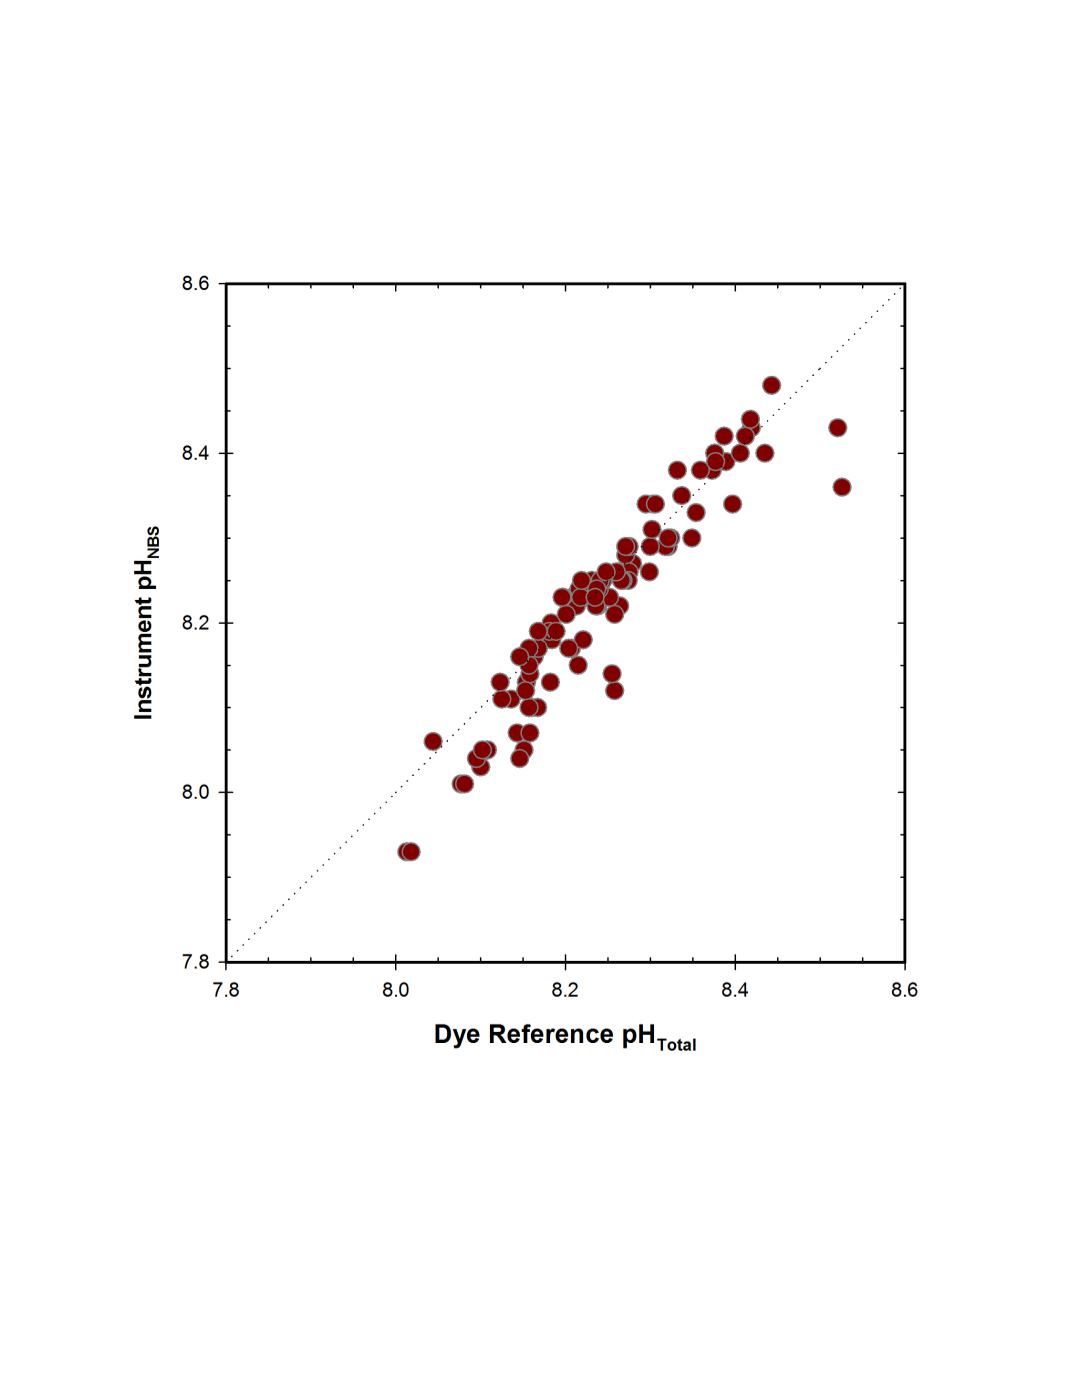
A cross-plot of the matched observations of EXO-pH2 and reference pH is given in
figure 30. The linear regression statistically significant (p=<0.001, r
2
=0.88) with a slope of 1.01
and an intercept of -0.05.
Figure 30.
GLERL field response plot for the Xylem EXO-pH2 instrument compared to reference pH
Total
samples. Fine dotted line represents 1:1 correspondence.
A regression of pH measured by EXO-pH1 and EXO-pH2 was highly significant
(p<0.001, r
2
=0.88) with a slope of 1.07 and intercept of -0.61 (data not shown).