


 56 / 73

Ref. No. [UMCES] CBL 2015-014
ACT VS15-07
56
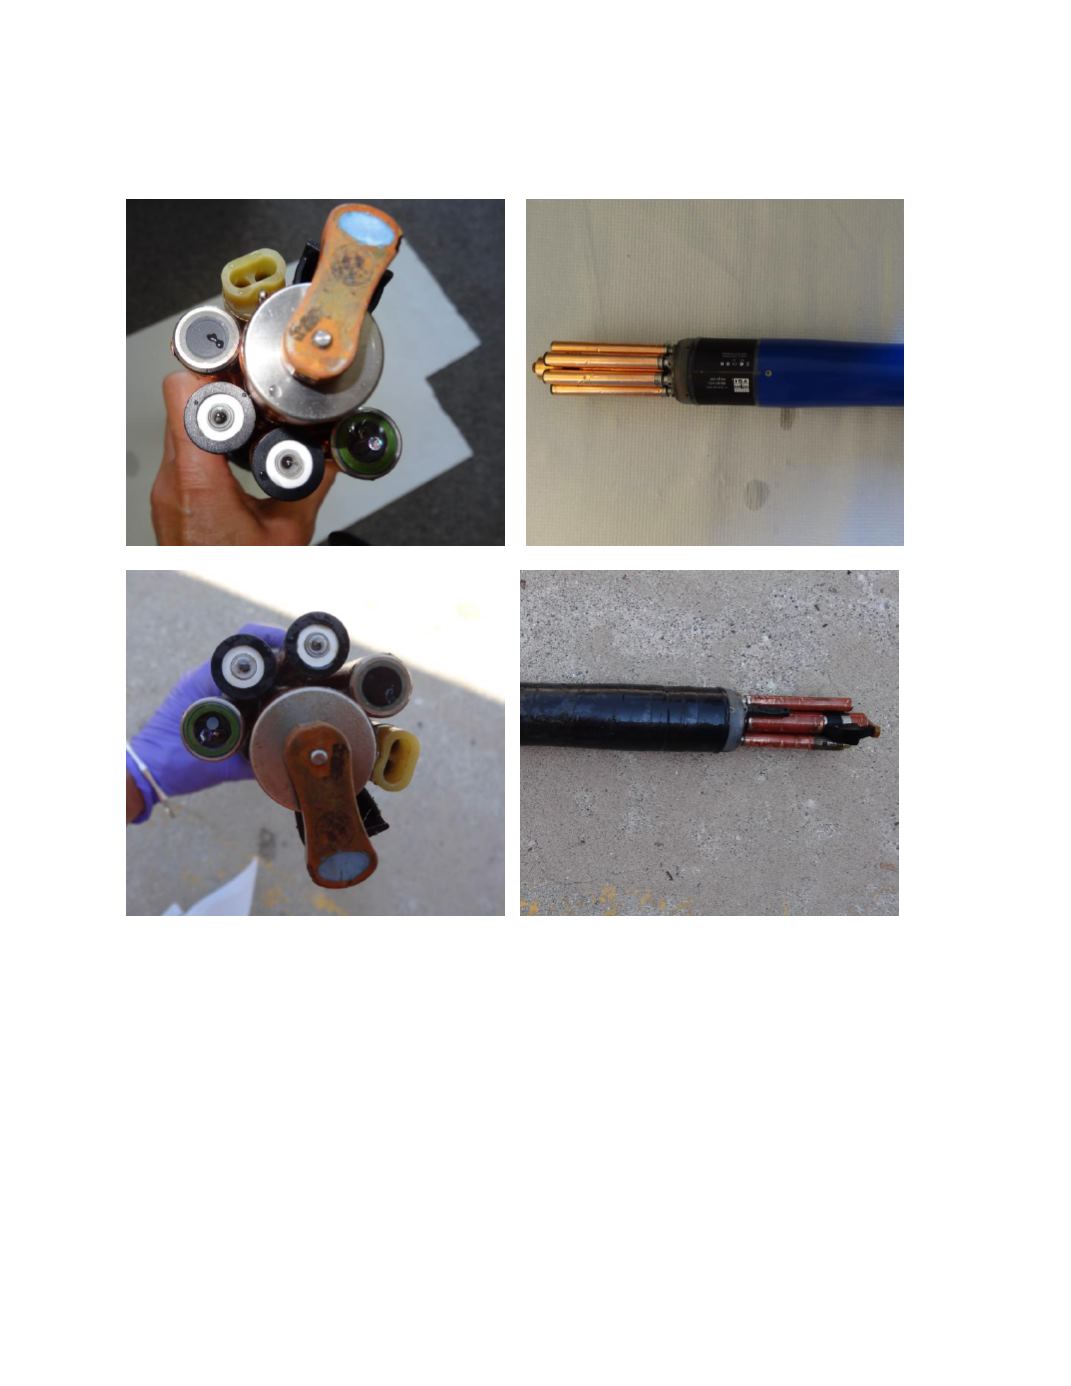
Photo 9.
The Xylem EXO pH sensor prior to and following the 1 month deployment for the Great Lakes
field test.
A summary plot of the matched EXO pH measurements and dye reference pH for all sites
is shown in figure 31 (both pH probes combined). The EXO results tracked changes in ambient
pH at all sites but the offset from the dye reference pH measurements was different for the
freshwater test compared to the brackish and seawater test sites, as was expected from the use of
NBS calibration buffers for the EXO compared to the dye reference pH
Total
scale.