


 31 / 58

Ref. No. [UMCES] CBL 2015-011
ACT VS15-04
31
Moored Deployment off Coconut Island in Kaneohe Bay, Hawaii
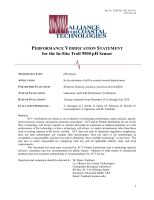
A three month-long moored field test was conducted in Kaneohe Bay from November 15,
2013 to February 10, 2014. The deployment site was located at 21.46° N, 157.80° W in the
back-reef region of the barrier reef offshore of Coconut Island (HIMB) in a depth of 3 meters
(Photo 4). Kaneohe Bay, located on the eastern side of Oahu, Hawaii, is a complex estuarine
system with a large barrier coral reef, numerous patch reefs, fringing reefs, and several riverine
inputs. Tides in Kaneohe Bay are semi-diurnal with mean tidal amplitude of approximately 68
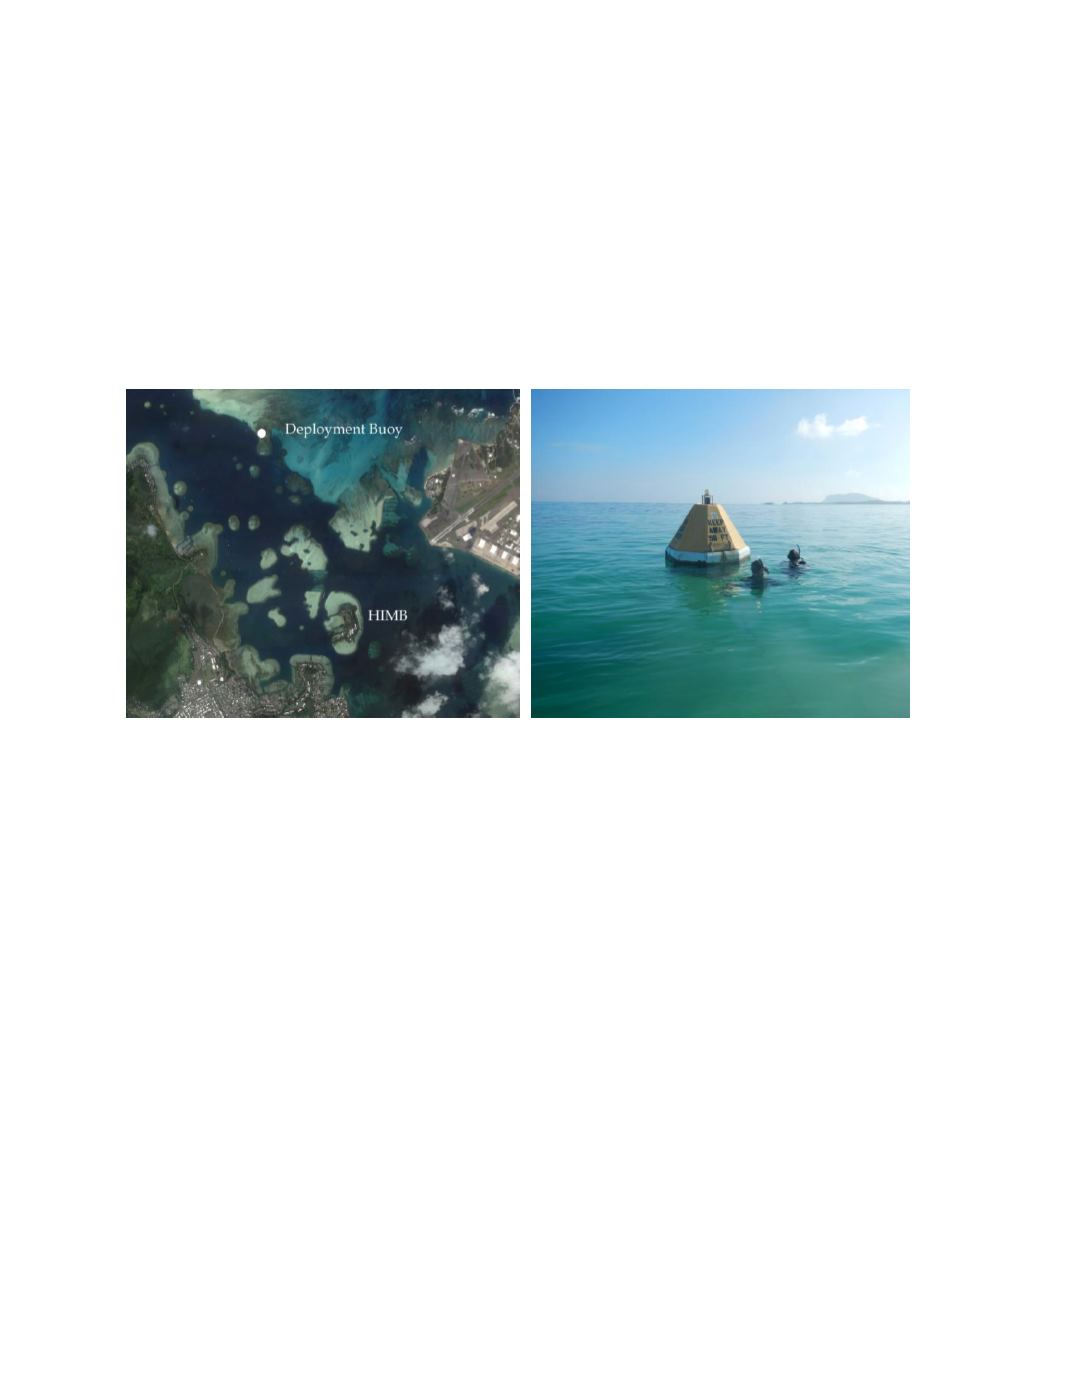
cm day. The pH instruments were mounted on the Crimp II Buoy (right), about on meter below
the surface.
Photo 4.
HIMB deployment site (left) and sampling at deployment buoy (right).
Time series results of ambient conditions for tidal height, temperature, and salinity are
given in figure 11. Temperature ranged from 22.3 to 26.5 and salinity from 32.8 to 35.2 over
the duration of the field test. The bottom panel displays the maximum difference recorded
between all reference thermistors mounted at the same depth but located across the mooring
rack. The average temperature difference observed across the space of the mooring rack was
0.04 ±0.10
o
C, with a maximum of 0.65
o
C. As noted above, it is not possible to quantify the
exact difference between the averaged reference temperature and that measured by the test
instrument, but differences resulting from this variation and variation in the chemistry of the
water across will be minimized by the sampler integrating across the mooring space.
The Troll 9500 only operated over the first three days of the deployment and generated
154 observations measured at 30 minute intervals. On November 18
th
at 21:30 the battery
voltage dropped from 2.9 to 1.5 and logging terminated. The time series results of the Troll 9500
and corresponding reference pH results are given in figure 12. Ambient pH measured by the
Troll 9500 in these first few days ranged from 7.93 to 8.17, compared to a range in reference pH
values over the same time of 7.905 to 7.971. The bottom panel presents the time series of the
difference between instrument and reference measurements for each matched pair (n=10
observations out of a possible 101 for the entire deployment). The average and standard
deviation of the differences were 0.10 ±0.01 with a total range in the differences of 0.09 to 0.11.