


 36 / 58

Ref. No. [UMCES] CBL 2015-011
ACT VS15-04
36
Moored Deployment at Chesapeake Biological Laboratoriy (CBL)
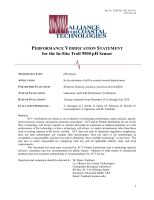
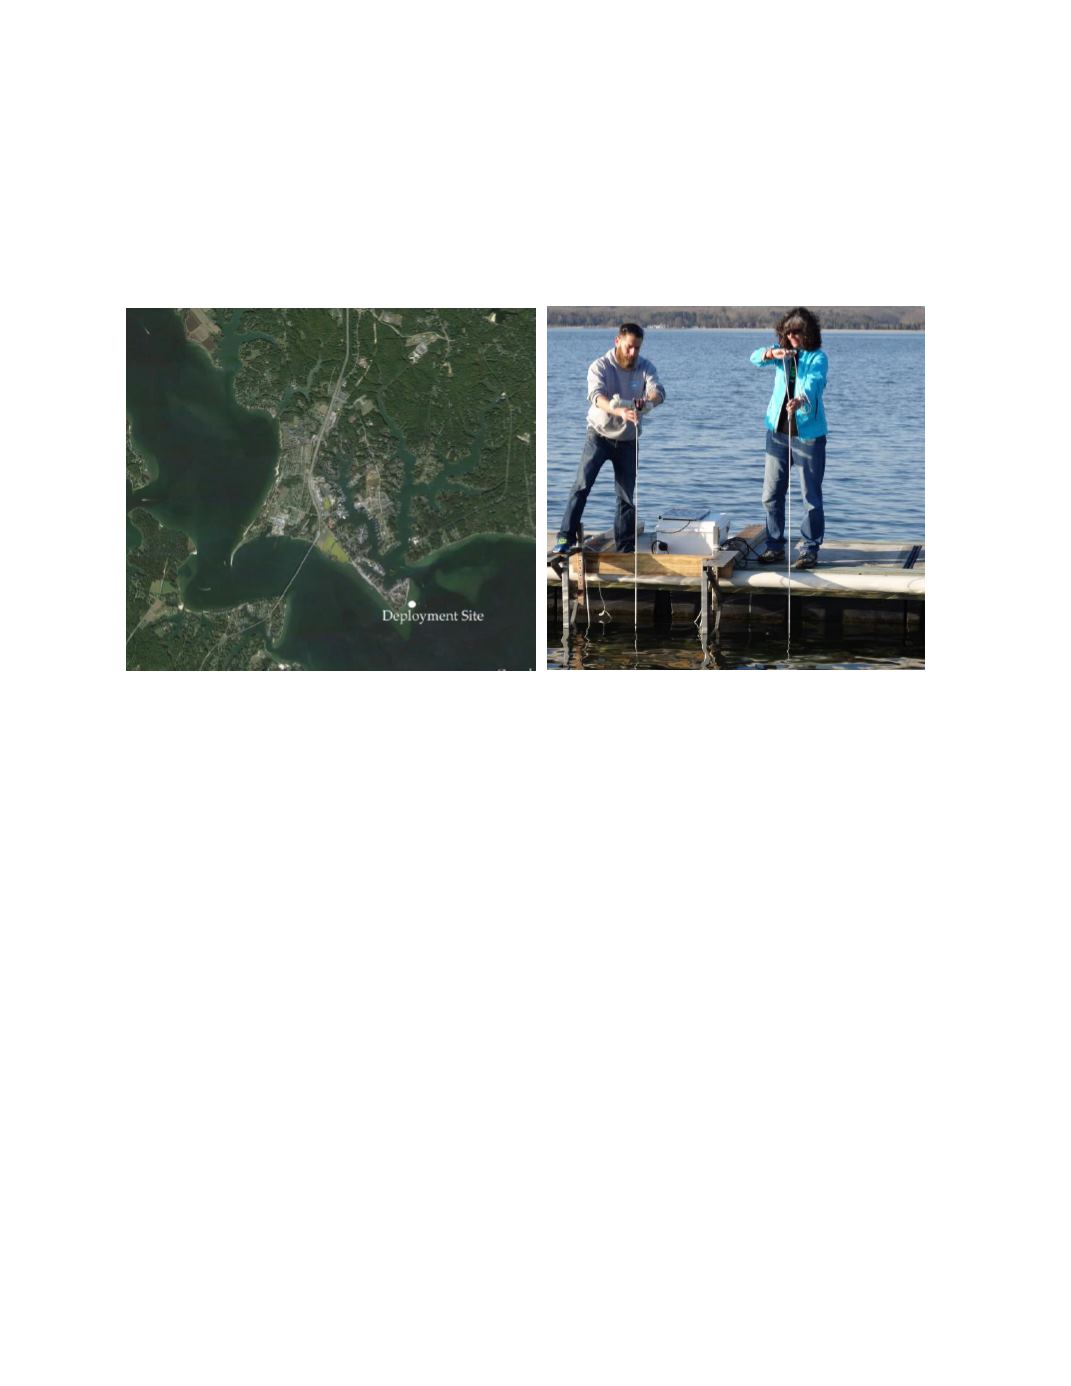
A month-long moored field test was conducted in Chesapeake Bay from March 3 to April
10, 2014. The deployment was located at 38.32° N, 76.45°W attached to the end of a pier at the
mouth of the Patuxent River (Photo 6.) The average water depth of the test site was 2.2 m. The
site was brackish with salinity ranging from 9.1 to 14.3 during the deployment and temperature
ranging from 3.3 °C to 10.2 °C.
Photo 6.
Aerial view of CBL deployment site (left) and duplicate sampling at mooring rack.
Time series results of ambient conditions for tidal height, temperature, and salinity are
given in figure 14. Temperature ranged from 3.4 to 10.1 and salinity from 9.3 to 14.0 over the
duration of the field test. The bottom panel displays the maximum difference recorded between
all reference thermistors (RBR Solo and SBE26) mounted at the same depth and different
locations across the mooring rack. The average temperature difference observed across the space
of the mooring rack was 0.04 ±0.06
o
C, with a maximum of 1.38
o
C. As noted above, it is not
possible to quantify the exact difference between the averaged reference temperature and that
measured by the test instrument, but differences resulting from this variation and variation in the
chemistry of the water across will be minimized by the sampler integrating across the mooring
space.
The Troll 9500 operated continuously over the entire 30 day deployment and generated
2756 pH measurements at 15 minute intervals, however after the first six hours a significant
measurement deviation occurred and continued throughout the test. Only the first 26 instrument
measurements and only one matched reference sample pair could be considered useable. Time
series results of the Troll 9500 and corresponding reference pH results are given in figure 15.
Ambient pH measured by the Troll 9500 over the first six hours ranged from 8.34 to 8.82,
compared to the entire range from reference measurements of 8.024 to 8.403. The bottom panel
presents the time series of the difference between the instrument and reference pH for each
matched pair (n=107 observations). The first sampling pair from March 12
th
had a difference of
-0.002 indicating the probe was in good operating condition at the time of deployment. No
summary statistics are calculated for the remaining deployment.