


 41 / 57

Ref. No. [UMCES] CBL 2015-010
ACT VS15-03
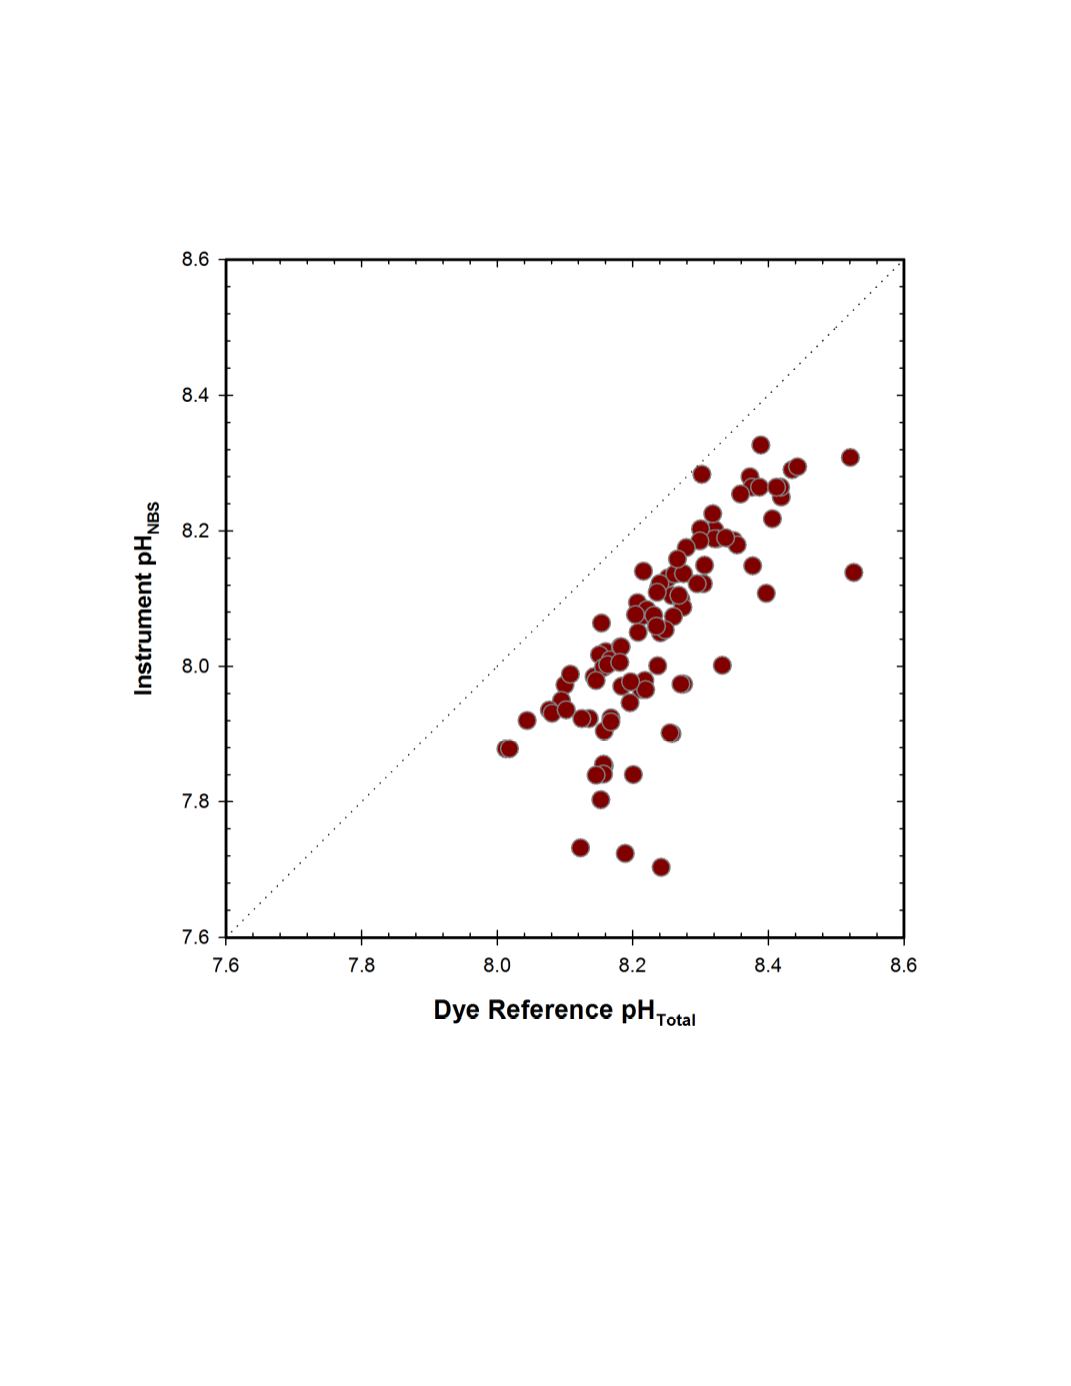
A cross-plot of the matched observations is given in figure 17. The linear regression was
statistically significant (p<0.001, r
2
= 0.64), with a slope of 1.05 and intercept of -0.61.
Figure 17.
GLERL field response plot of Idronaut 305 Plus pH sensor compared to reference pH
Total
samples. Fine dotted line represents 1:1 correspondence.
41