


 43 / 57

Ref. No. [UMCES] CBL 2015-010
ACT VS15-03
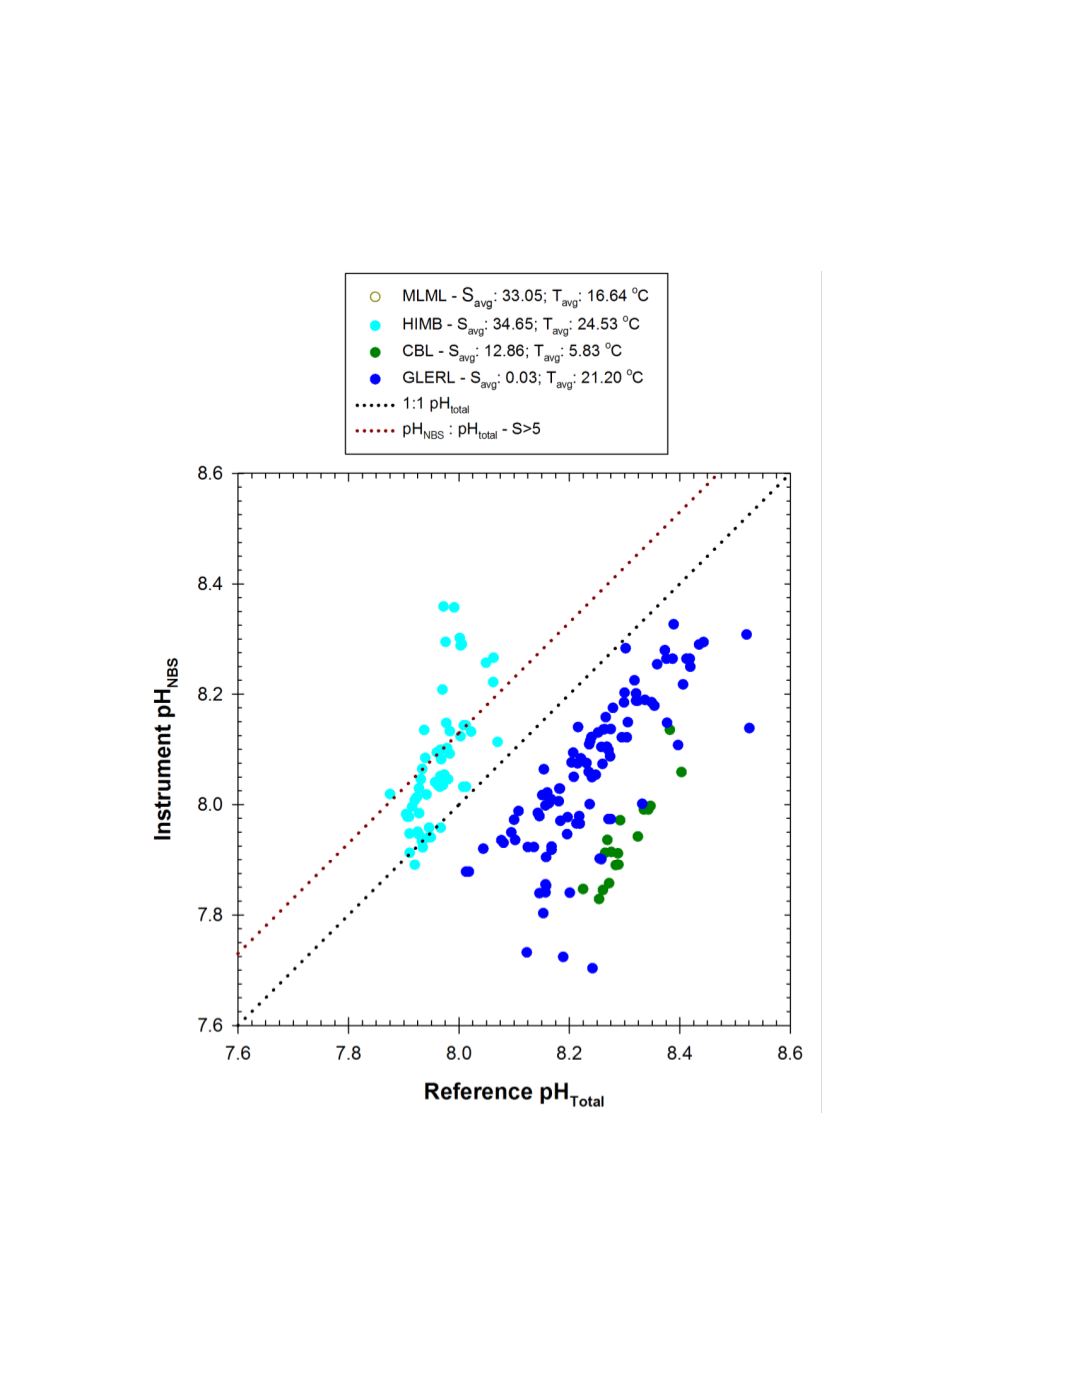
A summary plot of the matched Idronaut 305 Plus pH measurements and dye reference
pH for all field sites is shown in figure 18. The 305 Plus tracked changes in ambient pH at all
sites but the response factor (slope) and overall offset from the dye reference pH measurements
was different at each site.
Figure 18
.
Global response plot for Idronaut 305 Plus pH sensor observed during ACT field trials.
Black dotted line represents 1:1 correspondence, dark red dotted line represents correspondence predicted
based on difference between pH
NBS
and pH
Total
in seawater (pH
NBS
= pH
Total
+ 0.13).
43