


 14 / 59

Ref. No. [UMCES] CBL 2016-013
ACT VS16-04
14
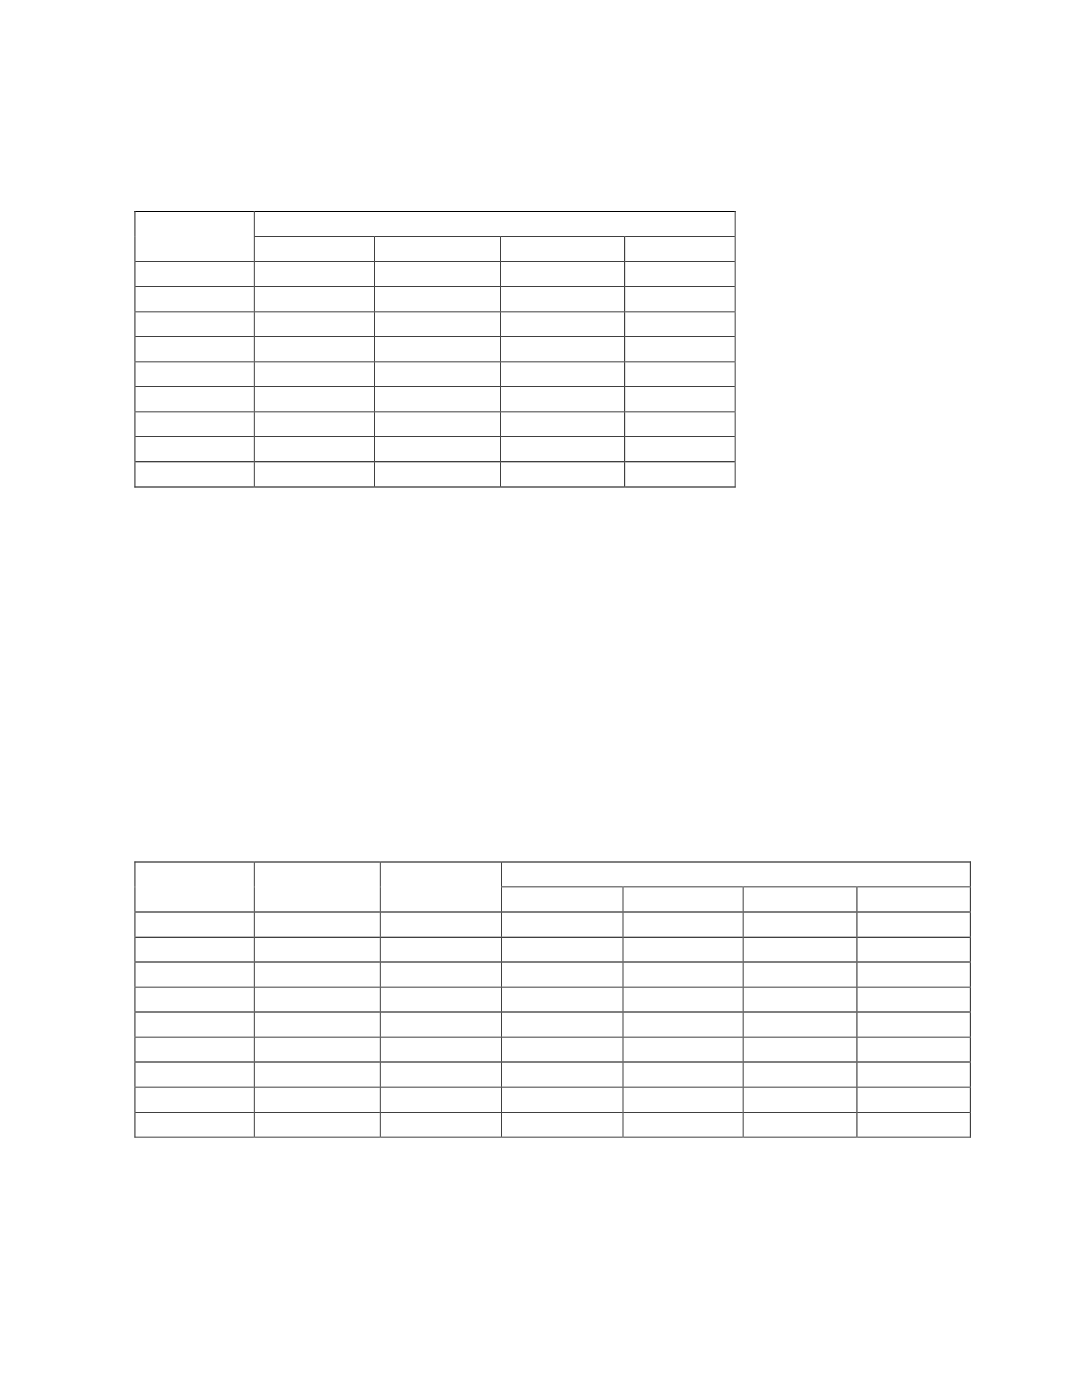
Table 2.
Summary of the mean and standard deviation of offsets between paired HOBO sensor measures
and Winkler reference DO measures during laboratory trials.
Trial ID
Instrument – Winkler DO
mean
s.d.
Observed n Possible n
L_T15_S00
0.192
0.214
51
51
L_T15_S10
0.086
0.147
39
39
L_T15_S35
0.047
0.113
38
38
L_T04_S00
0.314
0.324
39
39
L_T04_S10 0.208
0.218
36
36
L_T04_S35
0.111
0.140
37
37
L_T30_S00
0.079
0.149
40
40
L_T30_S10
0.114
0.145
39
39
L_T30_S35
0.102
0.128
40
40
The precision of the HOBO U26 sensor was also characterized for each of the nine
temperatures and salinity trials (Table 3). Precision trials were conducted at the start of each new
tank test when conditions were most stable. Instruments were equilibrated in test tanks at indicated
temperature and salinities for 45 min then the subsequent 31 one-minute measurements were used
to estimate average tank DO (mg/L) and its variation over that interval. The absolute precision,
estimated as the standard deviation (s.d.) around the mean, ranged from 0.003 – 0.013 mg/L across
trials with an overall average of 0.006 mg/L. Relative precision, estimated as the coefficient of
variation (CV% = (s.d./mean)x100), ranged from 0.036 – 0.268 percent across trials with an
overall average of 0.074%.
Table 3.
Characterization of the precision of the HOBO U26 sensor over a range of temperatures and
salinities test conditions.
Trial ID
Temperature
Salinity
Dissolved Oxygen Reading
mg/L mean
mg/L s.d.
CV%
n
L_T15_S00
15.44
0.00
9.478
0.006
0.065
31
L_T15_S10
15.47
8.82
9.570
0.004
0.038
31
L_T15_S35
15.39
34.20
8.349
0.003
0.036
31
L_T04_S00
5.40
0.00
12.696
0.006
0.044
31
L_T04_S10
5.30
8.98
12.384
0.007
0.054
31
L_T04_S35
5.23
34.77
10.813
0.006
0.054
31
L_T30_S00
30.22
0.00
4.913
0.013
0.268
31
L_T30_S10
30.51
9.28
7.048
0.004
0.057
31
L_T30_S35
30.61
34.43
5.961
0.003
0.050
31