


 31 / 59

Ref. No. [UMCES] CBL 2016-015
ACT VS16-06
31
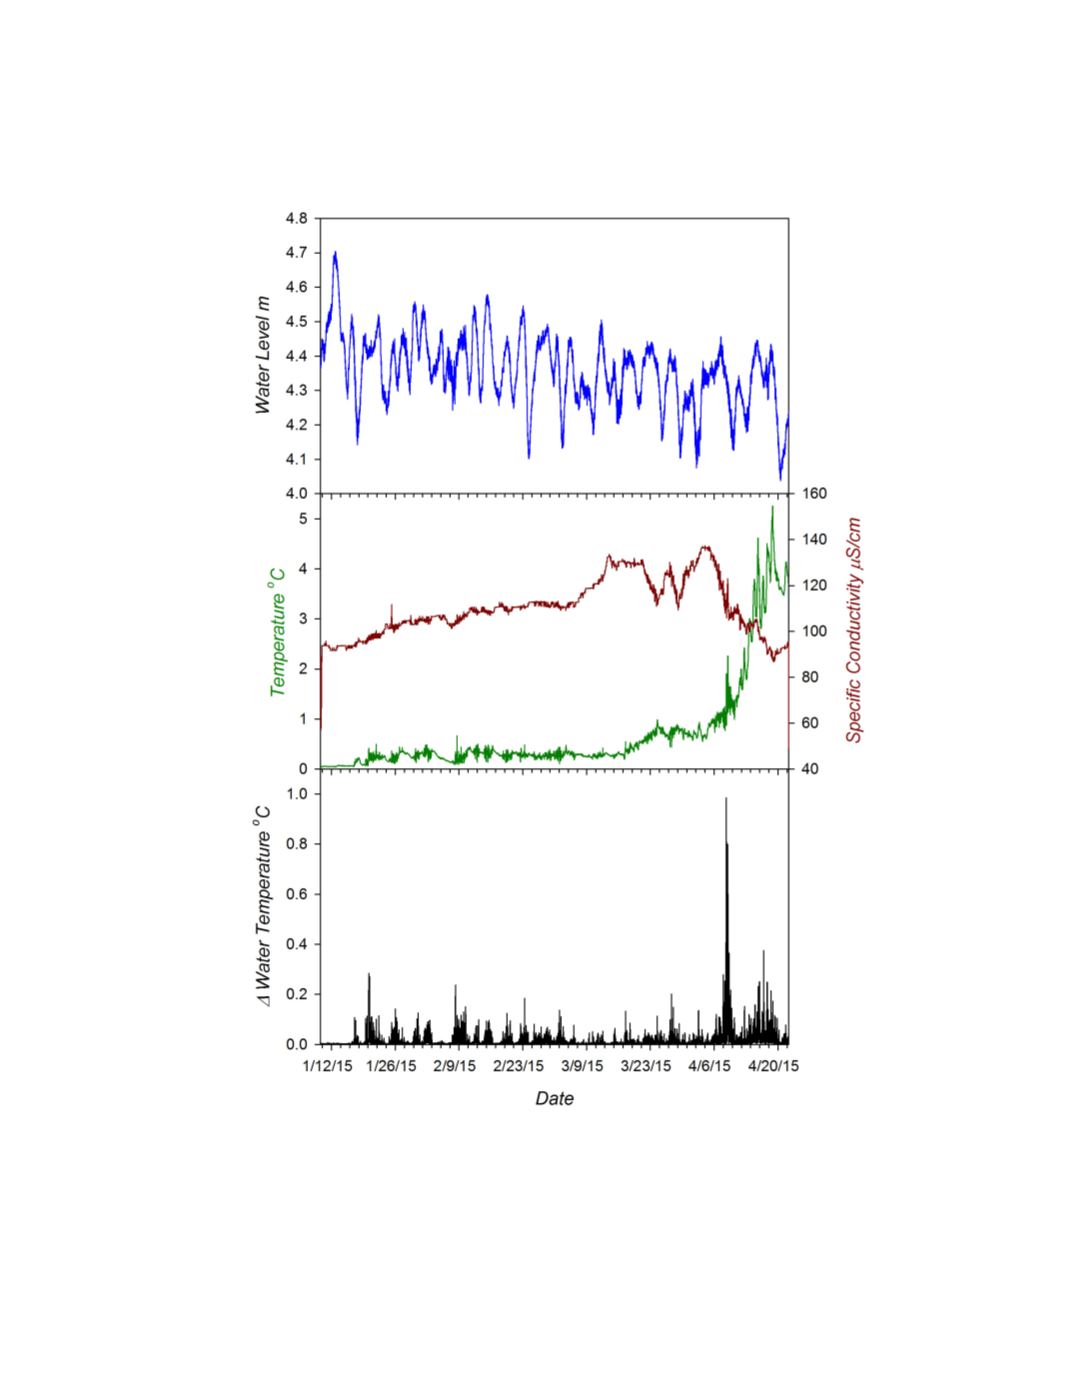
compared to the range captured by reference samples of 10.249 to 14.007. The sharp excursion
between April 8 - 9 was real and was picked up by all instruments and correspondingly seen in
specific conductance and temperature variability across the instrument rack (Fig. 1).
The time series of the difference between instrument and reference DO measurements for
each matched pair (n=118 observations) is given in the bottom panel of figure 2. The average and
Figure 1.
Environmental conditions encountered during deployment at the MTU site. Test sensor array deployed at
4.5 m fixed depth, variation in local water levels indicate active water flow around instruments (
Top Panel
). Variation
in specific conductivity (red) and temperature (green) at depth of instrument sensor detected by an SBE 26 and two
RBR Solo thermistors (
Middle Panel
). Temperature range deter ined from max-min temperatures detected by 4 RBR
thermistors spanning instrument sensor array (
Bottom Panel
).