


 46 / 59

Ref. No. [UMCES] CBL 2015-008
ACT VS15-01
46
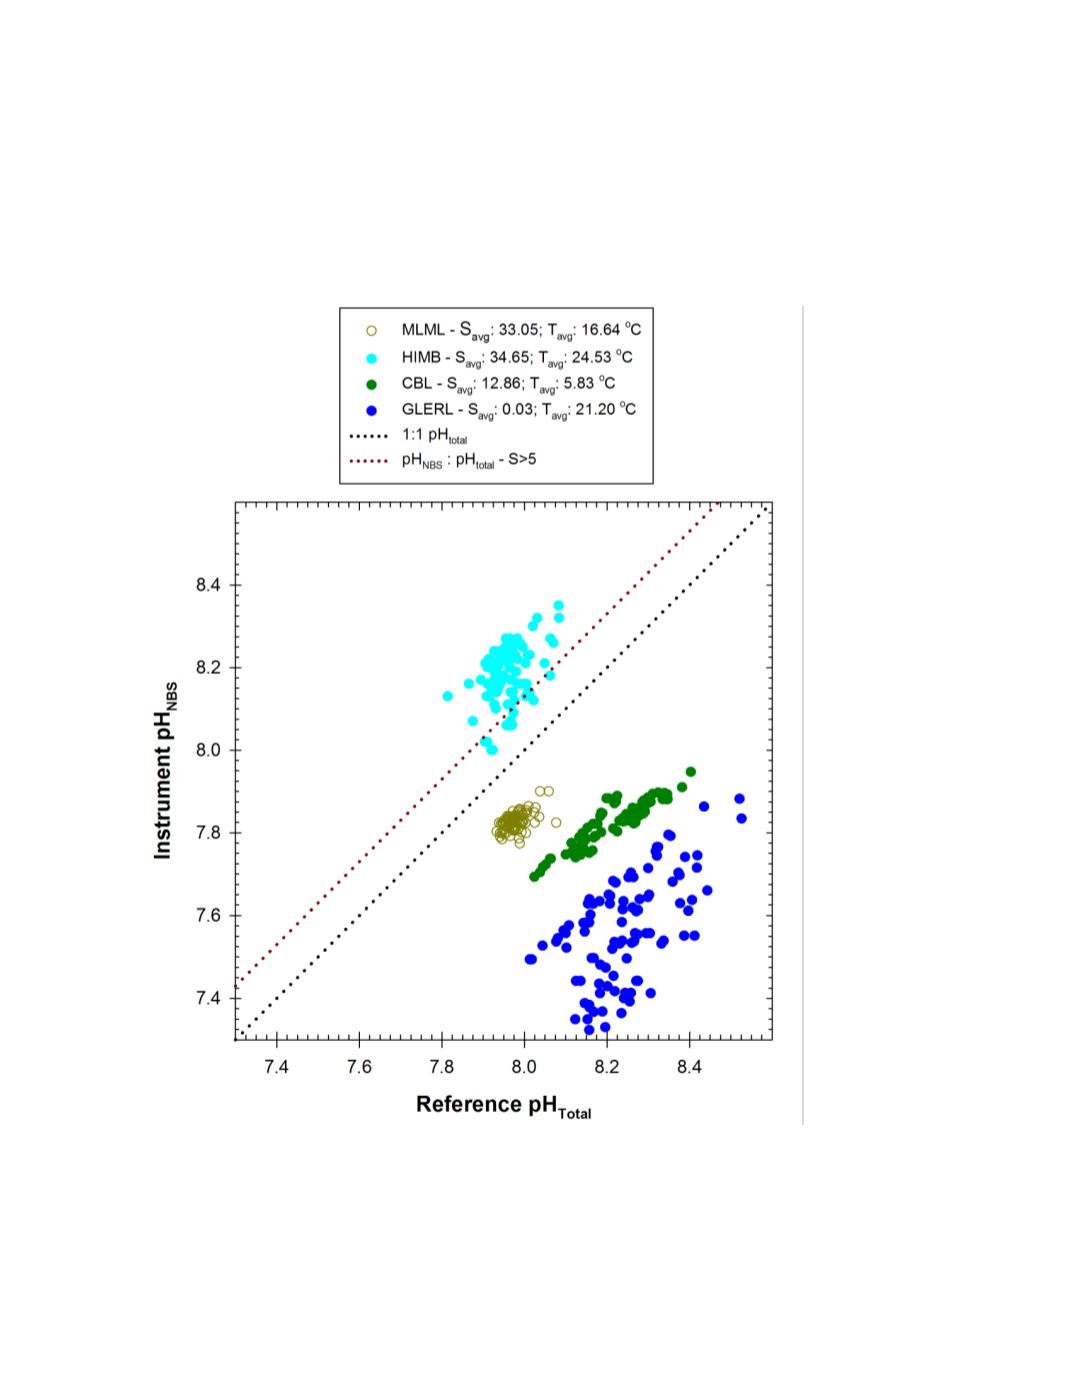
A summary plot of the CSI versus dye reference pH for all field deployment tests is
shown in figure 20. The CSI tracked changes in ambient pH but the offset from the reference pH
measurements was slightly different at all four test sites. The CSI under reported pH by an
average of 0.15, 0.40, and 0.68 pH units at Moss Landing, Chesapeake Bay, and the Great Lakes
respectively. In contrast the CSI over reported pH relative to the dye reference measurement by
0.22 for the Hawaii field test.
Figure 20.
Global response plot for Campbell Scientific Instruments pH sensor observed during ACT
field trials. red dotted line represents 1:1 correspondence, black dotted line represents correspondence
predicted based on difference between pH
NBS
and pH
Total
in seawater (pH
NBS
= pH
Total
+ 0.13).