


 44 / 59

Ref. No. [UMCES] CBL 2015-008
ACT VS15-01
44
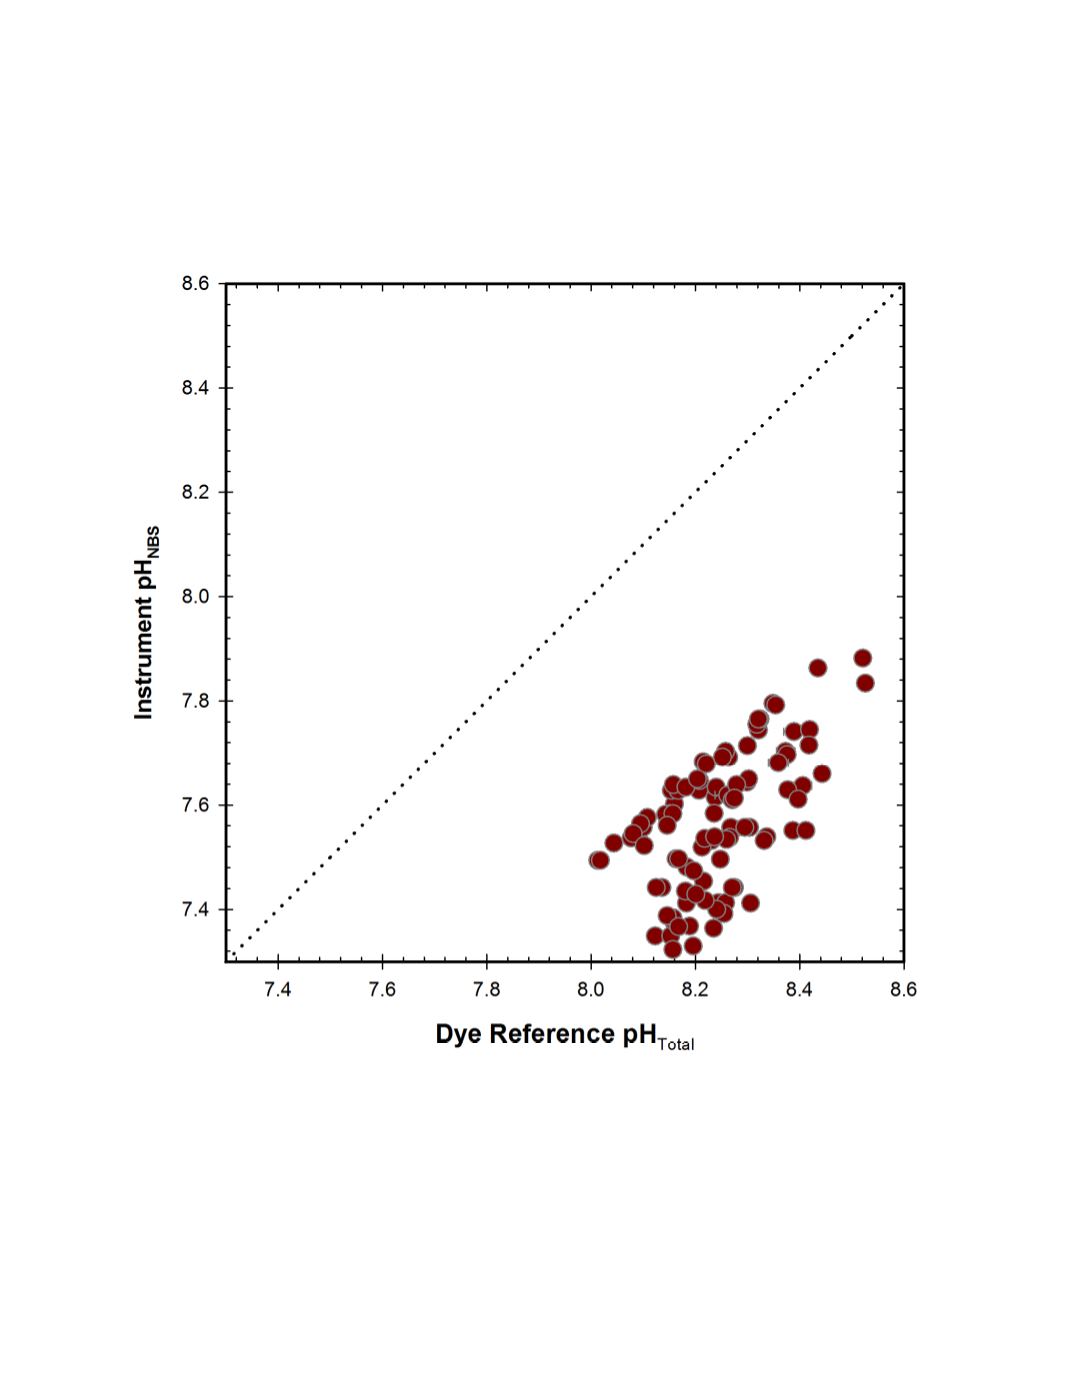
A cross-plot of the matched observations is given in figure 19. The linear regression was
statistically significant (p<0.001, r
2
= 0.35). The slope of the regression was 0.716 with an
intercept of 1.663.
Figure 19.
GLERL field response plot of Campbell Scientific Instruments (CSI) pH sensor compared to
reference pH
Total
samples. Black dotted line represents 1:1 correspondence.