


 25 / 59

Ref. No. [UMCES] CBL 2016-011
ACT VS16-02
25
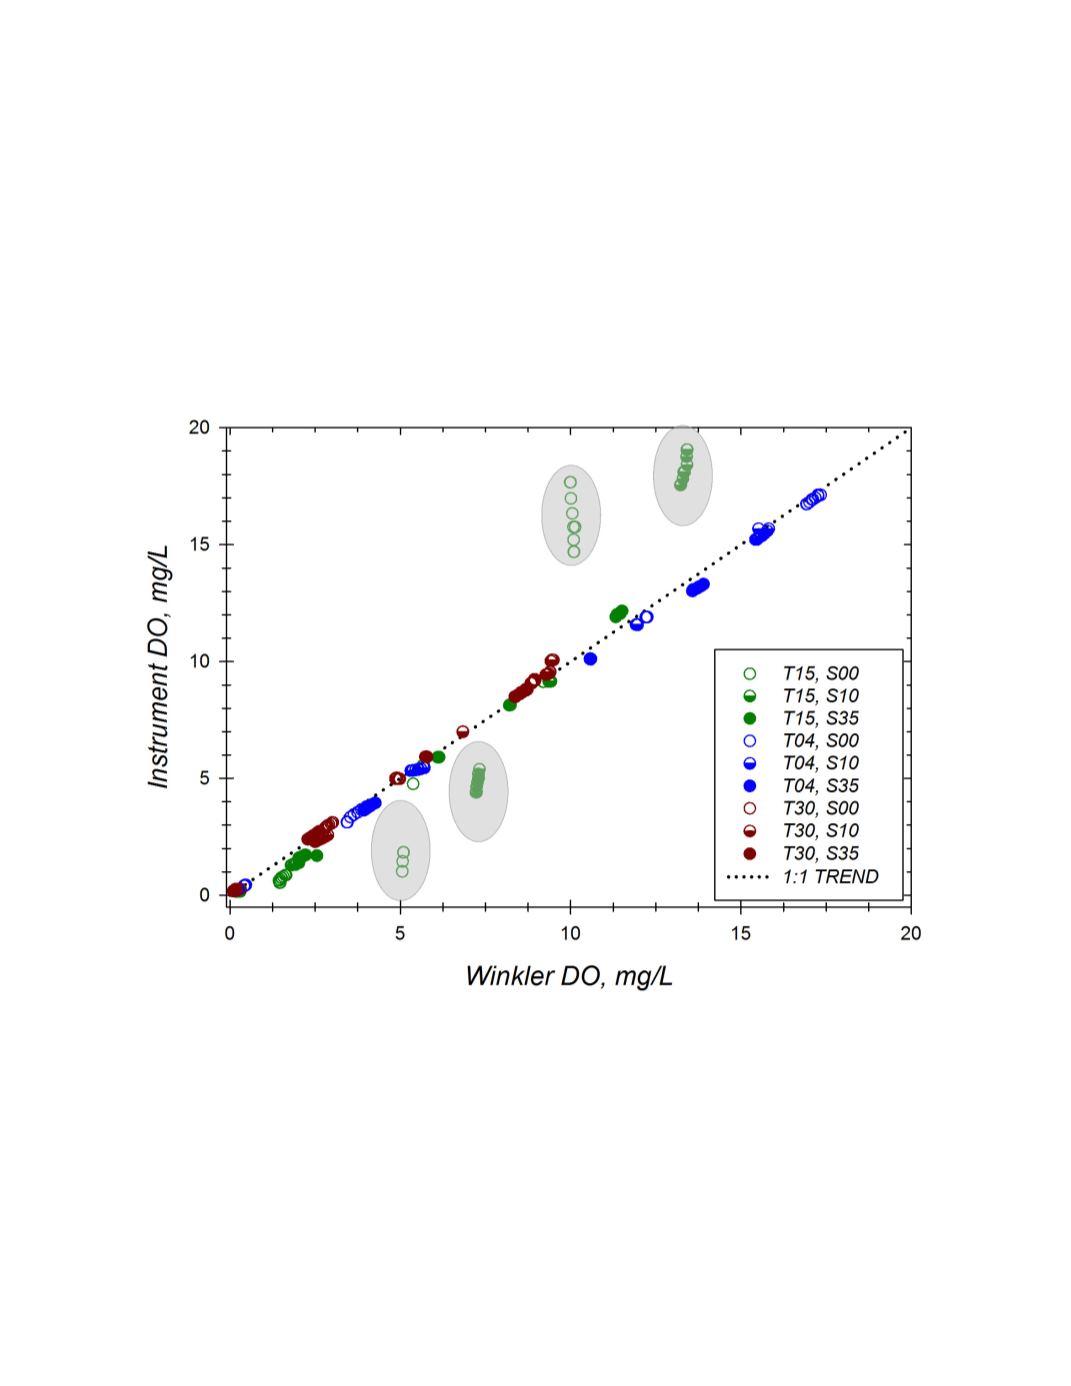
The global response of the PME miniDOT for all nine temperature-salinity trials is shown
in figure J. In general readings are well correlated across the entire range of DO concentrations
(hypoxic to supraoxic) covering all temperature and salinity ranges tested. Highlighted deviation
likely reflects bubble contamination of the sensor foil. A linear regression of the data (n=334; r
2
=
0.973; p<0.0001) produced a slope of 0.98 and intercept of 0.020. Highlighted data were omitted
from the regression because of expected bubble contamination.
Figure J.
Concordance of the PME miniDOT (sn 7392-340698) oxygen measures paired with
discrete Winkler DO reference samples. In general readings are well correlated across a range of
DO concentrations (hypoxic to supraoxic). Offsets in instrument readings increase at higher DO
levels and with salinity. Dotted line represents perfect agreement between the two measures.