


 45 / 59

Ref. No. [UMCES] CBL 2016-014
ACT VS16-05
45
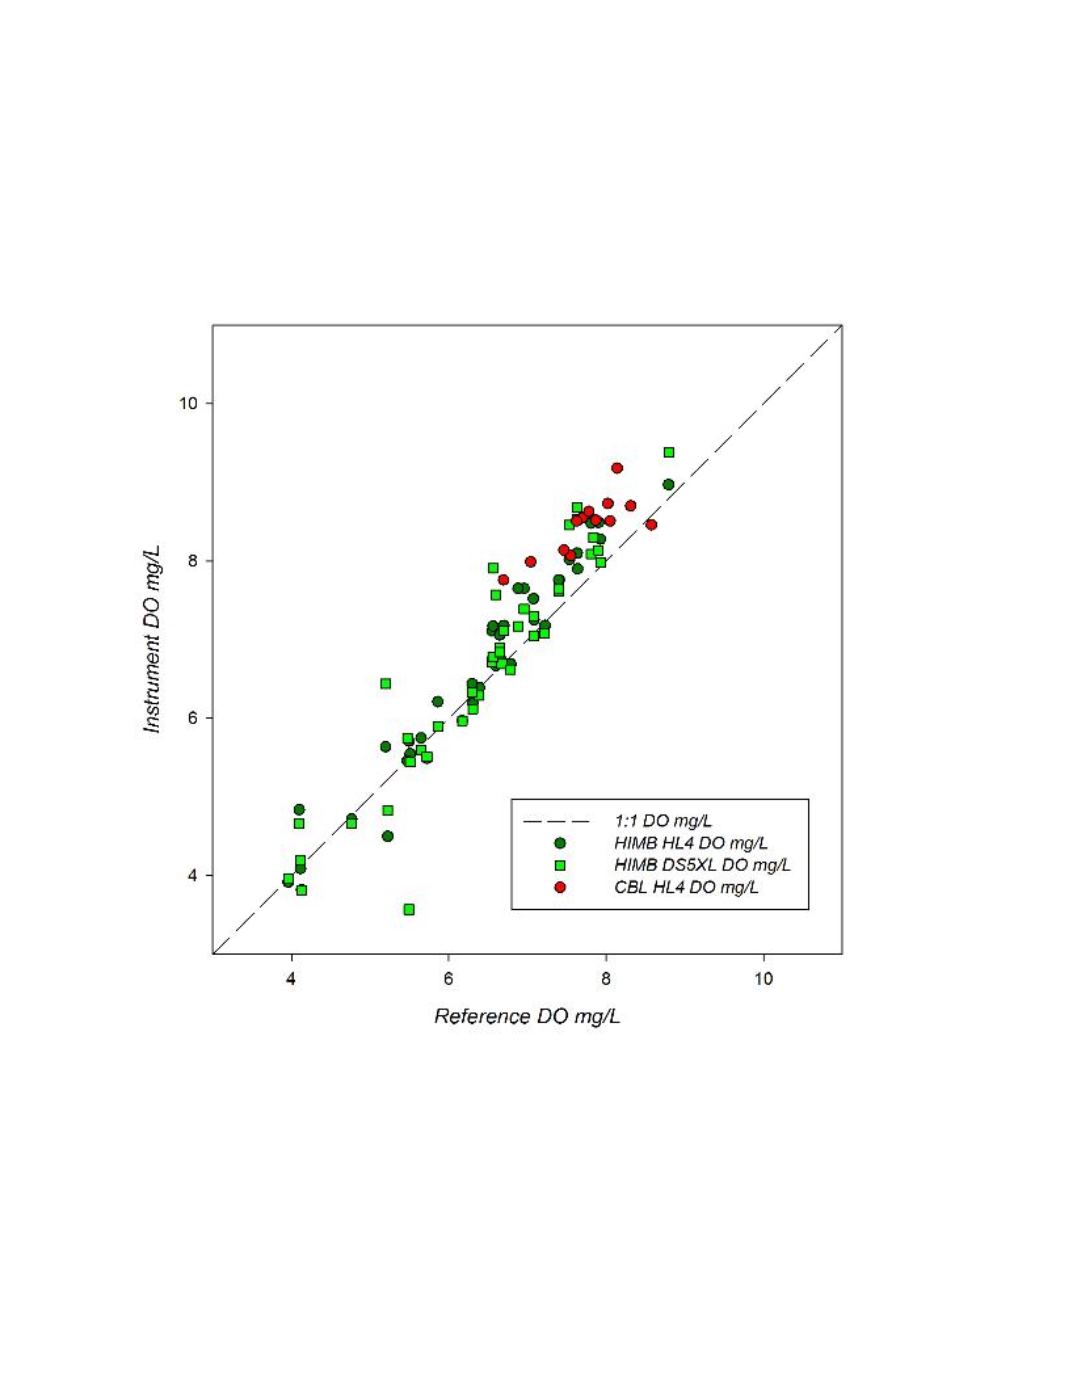
A global summary of instrument versus reference readings for two field deployment sites
are plotted in figure 10. The response curves were generally consistent across the concentration
range within a given test site as well as over the wide range of DO conditions (4 - 14 mg/L) across
sites regardless of temperature or salinity. A linear regression of the subset data (r
2
= 0.91
p<0.0001)) had a slope of 1.151 and intercept of -0.725.
Figure 10.
Global response plot for the HL4 (circles) and DS5XL (squares) instruments observed during the
three ACT field trials. Black dotted line represents a 1:1 correspondence.