


 40 / 48


Ref. No. [UMCES] CBL 2015-012
ACT VS15-05
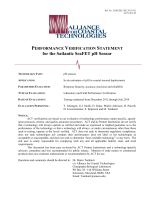
A summary plot of the SeaFET versus dye reference pH for all sites is shown in figure
15. The SeaFET responded consistently with good agreement to reference pH measurements at
the brackish and saline sites, which covered a salinity range of 9 to 35 and temperatures from 3
to 26
o
C. Results for the freshwater field test showed a consistent response over the range of
observed pH, but with an offset of approximately -0.18 pH units. The SeaFET was calibrated in
low ionic strength NBS buffers for this deployment test so the reason for the higher offset is
unclear.
Figure 15.
Global response plot for the SeaFET instruments observed during the ACT field trials. Black
dotted line represents 1:1 correspondence, red dotted line represents correspondence predicted based on
difference between pH
NBS
and pH
Total
in seawater (pH
NBS
= pH
Total
+ 0.13).