


 37 / 48

Ref. No. [UMCES] CBL 2015-012
ACT VS15-05
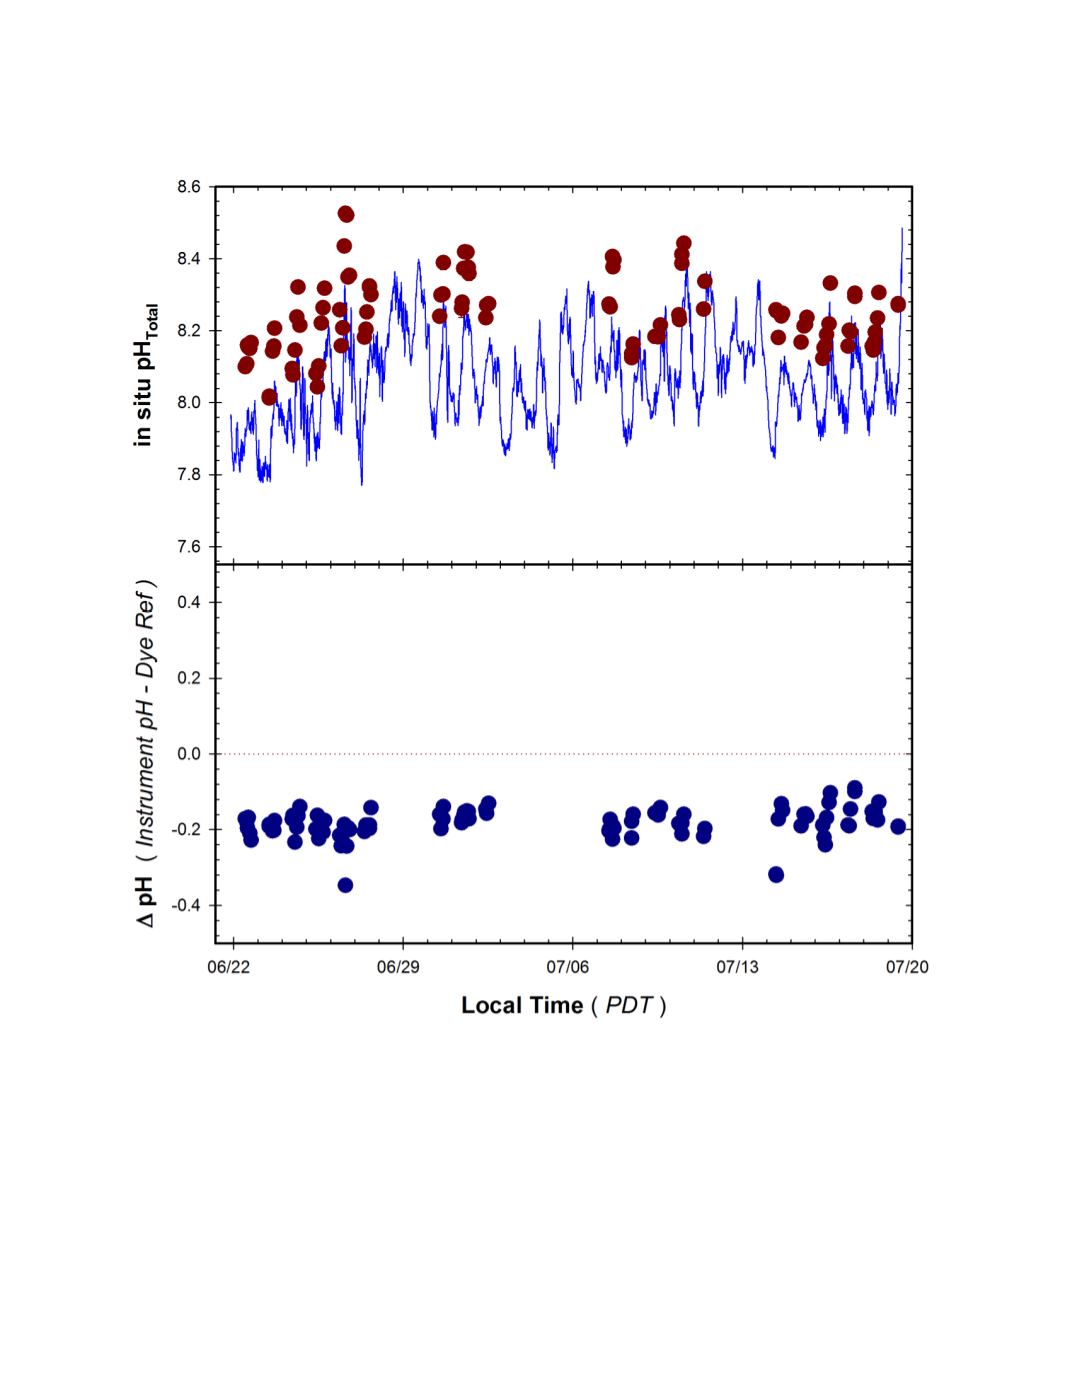
Figure 13.
Time series of pH measured by a SeaFET instrument deployed with SBE 5M pumping
system during the 1 month GLERL field trial.
Top Panel
: Continuous pH
Total
recordings from instrument
(blue line) and pH
Total
of adjacent grab samples determined by phenol red dye (red circles).
Instrument
values are pHint corrected for ambient T and S using processing software provided with the SeaFET
application
.
Bottom Panel
: Difference in measured pH relative to reference samples (Instrument – Dye
Ref) observed during deployment.