


 18 / 58

Ref. No. [UMCES] CBL 2015-011
ACT VS15-04
18
Once a week multiple reference samples were collected from the test tank in a burst, i.e.
sampled as rapidly as possible (including analysis time) to examine heterogeneity within the test
tank and repeatability of the reference pH results. The average standard deviation of the
reference pH value for ten burst sampling events was 0.0025 with a range of 0.0055 to 0.0005
(Table 1).
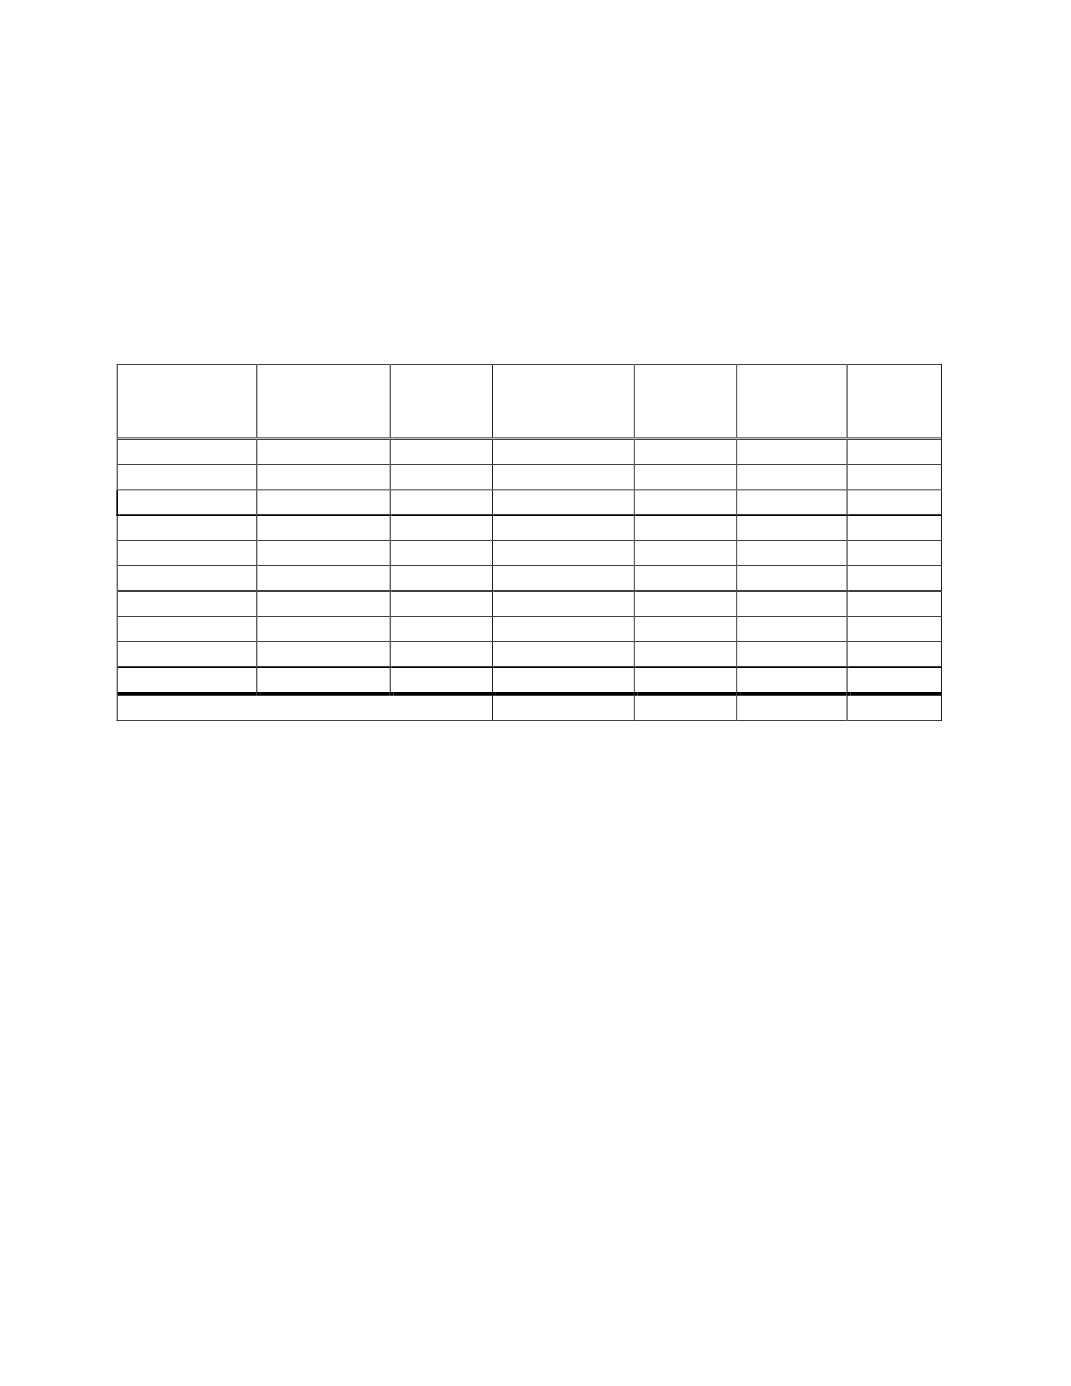
Table 1.
Results of burst sample analysis for the Lab Test to demonstrate consistency of test tank
conditions and repeatability of dye pH measurements.
Date
Measurement
Temperature
(
o
C)
Salinity
Time Interval
(min)
(# Obs)
Mean
Std Dev
CV
12/11/12
20.4
35
24 (n=5)
7.783
0.0021
0.026
12/15/12
20.7
35
10 (n=3)
7.762
0.0035
0.045
12/18/12
11.0
35
16 (n=4)
7.867
0.0017
0.022
1/4/13
29.8
22
8 (n=2)
7.973
0.0018
0.023
1/8/13
12.0
22
30 (n=5)
8.141
0.0055
0.068
1/15/13
20.5
22
29 (n=5)
7.860
0.0005
0.001
1/31/13
12.5
0.3
35 (n=5)
8.277
0.0054
0.065
2/6/13
20.4
0.3
65 (n=5)
7.881
0.0024
0.030
2/8/13
30.4
0.3
60 (n=5)
7.644
0.0013
0.018
2/12/13
25.5
34
39 (n=5)
7.934
0.0010
0.013
Overall Average
0.0025
0.032
The complete ten week time series for the In-Situ Troll 9500 pH sensor and
corresponding reference pH results are shown in Fig. 3. Although temperature and salinity were
tightly controlled and the test tank received a single batch of continuously circulated source
water, the pH varied considerably during each of the trials due to biological activity. These time
series results also include the rapid pH shifts that were conducted once a week under each of the
test T/S conditions using acid/base additions. Detailed plots of each pH transitions are provided
in Appendix I. In general, pH was varied by around 1.2 pH units during the acid/base additions
and conditions maintained at each new value for approximately an hour.
The Troll 9500 operated continuously throughout the entire lab test and generated 6283
pH measurements at 15 minute intervals. The total range of pH measured by the Troll 9500 was
7.12 to 8.58, compared to the range of our discrete reference samples of 6.943 to 8.502. The
Troll 9500 tracked changing pH conditions among all water sources and temperature ranges
including the rapid pH shifts from acid/base additions, but the magnitude of the offset changed
for each water type (Fig.3). For the complete Lab test, the mean of the differences between the
Troll 9500 measurement and reference pH was 0.17 ±0.07 (N=263), with a total range of 0.02 to
0.31. Instrument measurements conducted with the second seawater trial after ten weeks
showed a slight increase in the offset (mean difference = 0.31 ±0.004; N=8) compared to
measurements from the first week (mean difference = 0.15 ± 0.01; N=27) (data not shown).