


 25 / 59

Ref. No. [UMCES] CBL 2016-015
ACT VS16-06
25
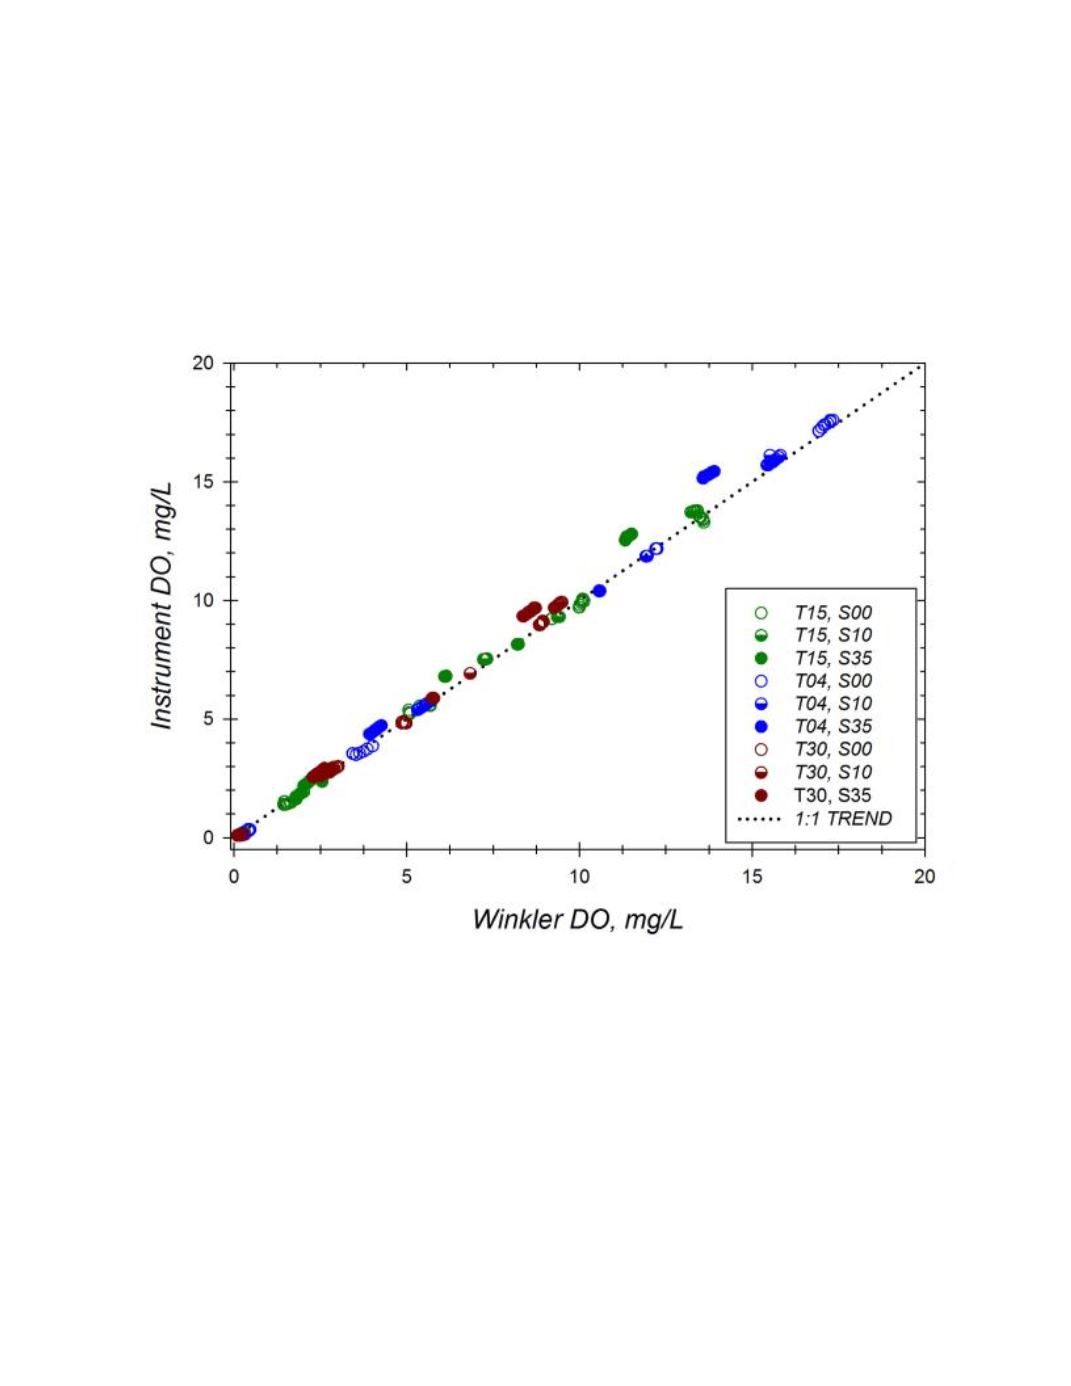
The global response of the EXO2 for all nine temperature-salinity trials is shown in figure
J. In general, readings are well correlated across the entire range of DO concentrations (hypoxic
to supraoxic) covering all temperature and salinity ranges tested. However as noted above there
was a greater offset at full salinity at each of three temperatures. A linear regression of the data
(n=359; r
2
= 0.996; p<0.0001) produced a slope of 1.029 and intercept of -0.039.
Figure J.
Concordance of EXO2 Sonde with Optical DO (sn 14J103998) oxygen measures paired with
discrete Winkler DO reference samples. In general readings are well correlated across a range of DO
concentrations (hypoxic to supraoxic). Dotted line represents perfect agreement between the two measures.
Individual response slopes and intercepts of instrument versus reference DO for each of the
laboratory trials are summarized in Table 4. Similar to the increased magnitude of differences
across salinity levels within the laboratory trials (Table 2), the slopes of the instrument response
curves increased with the level of salinity, although instrument response remained highly linear
across all trials.