


 44 / 58

Ref. No. [UMCES] CBL 2015-011
ACT VS15-04
44
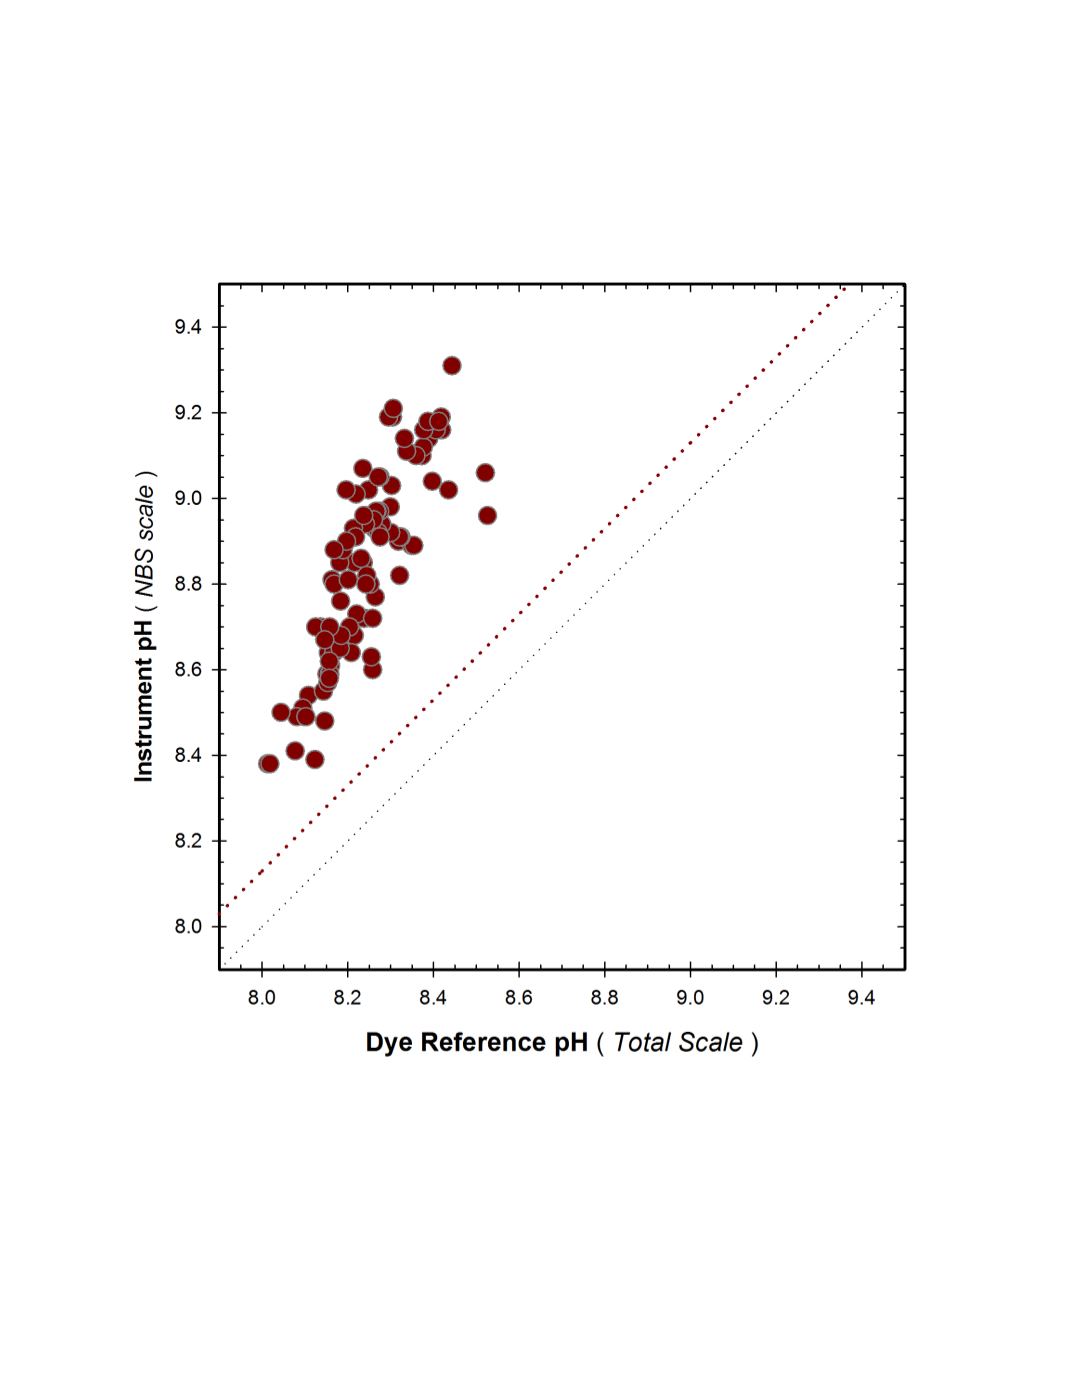
A cross-plot of the matched observations for the Great Lakes deployment test is given in
figure 19. The linear regression was statistically significant (p<0.001, r
2
= 0.70), with a slope of
1.74 and intercept of -5.37.
Figure 19.
GLERL field response plot of Troll 9500 pH sensor compared to reference pH
Total
samples.
Fine dotted line represents 1:1 correspondence, coarse dotted line represents correspondence predicted
based on difference between pH
NBS
and pH
Total
in seawater (pH
NBS
= pH
Total
+ 0.13).
No global summary figure could be generated to show direct comparison across all sites
due to the lack of comparable data from three of the four test sites.